Thursday, May 31, 2007

The Other Eric

My post, What does Eric Know, was featured Eric Sprott, and basically buying Roca at that time, when the market cap was about 1/3rd of what it is now, could make you lots of money.

The other Eric is Eric Schmidt of Google. He just cashed in and sold 57,084 option and sold them on the same day for an average price of $481.97, for $27.5 million.

Google is a great company, but it needs to at least double its revenue to support its current price, not an easy feat for a very large company.

End of post.

Read More......

Wednesday, May 30, 2007

A Closer Look at Two Income Trusts

Income Trusts - Park Your Money Investments featured a list of trusts from Income Trust Trader as well a few various people have mentioned to me. As of May 25th ITT's list has been updated.

They have a little more information, and their Monday post says they compute price trend values based on exponential moving averages and project those forward for a year. Expecting a pattern to continue for a year makes no sense to me.

First National AlarmCap (FNA) and UE Waterheater Income Fund have remained in the top two spot, although growth is now projected at 160% instead of 175%.

Since the post UE WaterHeater is up 1c or 0.04% and FNA is down 26c, but paid a 7c dividend for 19c down, or about 3% down.

A quick look at the fundamentals of FNA show that is $40 million market cap company that is the 3rd largest alarm sales, installation and monitoring companies. It has monitoring agreements generate $2.4 million monthly in recurring income. The previous 8 quarters show that the monitoring revenues have been declining, down about 5% in two year, and the number of clients is down 8-9% in that period. This raises a red flag.

A further look shows that the distributions have declined from $0.10833 to $0.07083.

FNA is paying a 13% dividend. They have identified problems that lead to losing customers and are working on reducing the loss of their client base. The dividend is about 70% of cash available so they have some cash to work on improvement. All things equal, when income trusts are taxed differently in 3-4 years, the dividend rate will decline to about 9%.

The downside risk is that as they lose customer base their overhead costs increase relative to their income and earnings decline faster than the rate of loss of clients. The opposite is true if they can grow their customer base. They appear to be in a strong enough position to turn around their attrition rate and they do have time.

For FNA the ITT's projection of 175% growth in a year seems highly unlikely, as does my simplified dividend ratio extrapolation that comes up with 75%. FNA seems fairly priced to me because of the declining customer base.

UE Waterheaters did not get included on the list I did because the dividend is 4.7%, well below my 7% cutoff. First glance is showing growth in earnings over the past 4 quarters. Checking further and there is a buyout offer at $23. It is trading at $22.79.

ITT's projection of 175% growth isn't going to work out on this one either.

Read More......

The Insiders

Joe_5000 asked an excellent question that is worthy of a post.

Where do you get insider trading data?


Go to sedi.ca and choose English from the home page.

On the Welcome page on the top right corner click "Access Public Filings."

From the public filings page on the left side click the yellow menu item "view summary reports."

From the summary reports page click the radial dial button titled "Insider transaction detail."

The Insider transaction detail page has the most to do on it. From the "Identify insider or issuer" menu select "Issuer Name" and type in at least the first word of the company name. From the "Identify Date Range" select "Date of Filing," and fill in the date range you would like to see. Select all on all 4 buttons to see everything. Then select search.

If more than one company starts with the name search criteria you gave they will all show up on the next page. Select the company you are interested it. You can see their holdings, if they cashed in warrants or options.

Yahoo gives insider information for American companies, but has no data on Canadian companies.

Check it out.

Read More......

FNX Mining - Cashing in on Nickel

"FNX quadruples resource base" boasted the press release, and adding up the
measured, indicated and inferred resources gives 1,087 million pounds of
copper, 1,105 million pounds of nickel and 1,016,000 oz of precious metals.

In US prices at $23.23/lb for nickel, $3.34/lb for copper, and $981 per
ounce precious metal for about $30 billion in today's dollars in the ground,
with stellar grades. At today's prices the average metal value per ton of
these new resources is $389, with the measured and indicated portion
averaging about $460/ton. At today's commodity prices the grades are highly
profitable.

So, how much money is FNX making?

FNX had a remarkable growth in earnings for Q1 2007, an increase of 845%
over Q1 2006, or $30.2 million versus $3.2 million. And shareholder have
done remarkably well, from a 52 week low of $9.05 to a high in the past week
of $35.25, or a 289% increase if perfectly timed.

But, for investors earnings need to evaluated relative to their investment.
FNX has 84 million shares and 2.5 million options give a dilute market cap
of about $3 billion. $30 million of earnings on $3 billion of market cap is
about 1% and extrapolated for a full year is about 4%, or a P/E of about 25.
Commodity prices are strong. A P/E above 12 simply is not a good idea when commodity prices are this strong unless there is a very compelling production growth story.

Taking a closer look at the Q1 earning and commodities prices in US they
realized were:

  • Ni $21.65
  • Cu $2.67
  • Pd $395
  • Pt $1530
  • Au $771
  • Co $31.34
The prices FNX realized for their production resulted in $12.3 million in
revenue above the LME average prices for Q1. They also realized even better
revenue because of the strength of the US dollar in Q1, an exchange rate of
1.17.

Price sensitivity is $1/lb change on nickel will change earnings by $9
million or $0.11/share, a $0.25/lb change in copper will change earnings by
$1.9 million or $0.02/share and a 10% movement in exchange rate will change
earnings by $12.7 million or $0.15/share. Currently commodity gains in
price are being canceled by currency losses.

The Q1 earnings included a 40% increase in production from the Levack
property. Overall production was 2.6 million pounds of nickel, 2.3 million
pounds of copper and 5,961 ounces of precious metals. At this rate they
would produce 10.4 million pounds of nickel, 9.2 million pounds of copper
and 24,000 oz of precious metals.

The year's production is forecast to be 12.7 million pounds of nickel,
10.9 million pounds of copper and 29,500 ounces of precious metal. The full
growth of 2007 has not yet been realized. Looking to 2008, production if
forecast to be about 17.5 million pounds of nickel, 40 million pounds of
copper and 64,000 oz of precious metals.

Further growth is planned through to 2010, for 24 million pounds of nickel,
100 million pounds of copper, and 135,000 ounces of precious metals.
From my way of evaluating an investment, FNX needs to double its earnings
to get to that P/E of 12 for production earning, and it looks doable for
2008 as long as commodity prices remain as strong as they are today. The
growth profile does give protection from downside risk from softening
commodity prices.

In the financial reports is a "comprehensive income" of $11.6 million that
should not be considered towards production earnings, and may result in a
one time only boost to earnings. This is from increases in equity
valuations that they own. To put into perspective of what including it on
earnings is equivalent to, consider a mutual fund. It buys equities that
the managers think will increase in price. The value of a share of the
mutual fund is the value of all the equities divided by the number of
shares.

So, consider the simplest mutual fund, with a single share. It buys an
equity worth $100 and that equity increases to $125, the value of that
mutual fund share is now $125. If that $25 dollars of equity gain was
instead consider earnings and the mutual fund was traded on earnings at that
P/E of 25 and the mutual fund share would be $25x25 = $625.

The value of equity increases to share holders needs to be evaluated the
same way a mutual fund is evaluated for its equity holdings. To evaluate as
earning is to make perilous errors in evaluating the value of your
investment. That $11.6 million dollar equity gain is worth
$11.6/86.4 million shares, or 13c per share, hardly a deciding factor one
way or another on a $34 stock.

The last thing, it never hurts to see what the insiders are doing. Part of
their income is from options so there usually is some selling. The question
is, how much?

Robert Cudney has a relationship to Northfield Capital which has sold
373,000 shares this year and he has personally sold 94,700.

Duncan Gibson shows 50,000 shares sold, Daniel Innes shows 37,987 shares
sold, Paul Makuch shows 33,333 shares sold, Daniel Owen 10,000 shares sold,
Donald Ross 23,500 shares sold.

Overall the insider selling is large and so is the cashing in.

Read More......

Sunday, May 27, 2007

The Commodity Bubble?

If you've been watching commodities at all you probably saw some doom and gloom news, Metals Bubble Poised to Burst on commodities, and it certainly sent commodity prices tumbling despite a continuing trend to lower LME warehouse levels, as the charts below show.

[Most Recent Quotes from www.kitco.com][Most Recent Quotes from www.kitco.com]
[Most Recent Quotes from www.kitco.com][Most Recent Quotes from www.kitco.com]

Zinc warehouse supplies are at their lowest levels in over 5 years, so just what is this commodity bubble?

There is no question that some company's share price has gotten way, way ahead of itself, like Goldcorp, and its valuation could be described as a bubble valuation.

Another company that has gotten ahead of itself is Blue Pearl, now known as Thompson Creek Metals, TCM-TSX. They have a share price of $16.63 and made 45c/eps their last quarter. Their molybdenum production is 21 million pounds per year, increasing to 27 million pounds, so earning should go up, right?

Wrong, for this quarter where they report 45c eps commodity prices were so strong, in their opinion, so they reduced their inventory levels and they sold 10.5 million pounds for the quarter, twice their level of guidance. They do not have the inventory levels to repeat this feat, so productions sales for Q2 should be about half of Q1 and production will not increase until they've built another mine.

Add to that that with the US dollar declining their Canadian costs will go up, about 10% over last quarter just based on recent strengthening of the Canadian dollar. Molybdenum prices are up for this quarter so it will offset some of the increased costs due to currency losses, but trying to make up for doubling their sales for a quarter simply isn't going to be covered by the increase in molybdenum price.

The other thing is that they earned $47.7 million dollars, and that is over 105,395,000 shares diluted, or so they report to get 45c/share. Currently they have 111,749,000 shares, 24,644,000 warrants and 6,943,000 options for fully diluted share capital of 143,336,000 shares, or about 36% more shares then reported. Average the earnings over the full dilution and you get 33c/eps.

Blue Pearl, aka Thompson Creek metals, is highly unlikely to come close to its Q1 earnings, but with 2007 earning potential to be in the range of $140-150 million and a fully diluted market cap of $2.4 billion, it just isn't the kind of return investors in base metals are looking for.

Read More......

Looking at Poor Operating Margins

I am constantly amazed at the amount of "value" investors are willing to give companies that constantly lose money, or make very little.

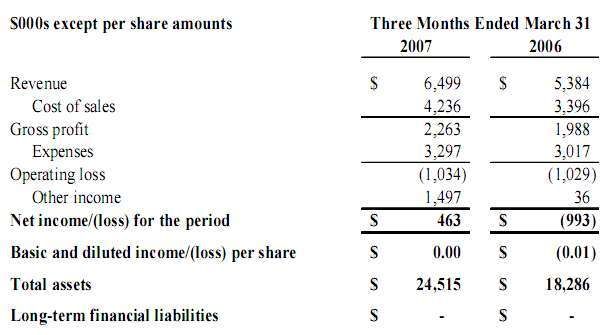
Take Sirit, for example, fully diluted at today's 48c/share price they have a market cap of $73 million. To have a P/E of 20 they need to have earnings of about $1 million per quarter. A P/E of 20 is high for any stock, imho, unless you can show good growth prospects.

View their first quarter results:

Photo Sharing and Video Hosting at Photobucket

The first thing this one says is that the cost of their supplies is about 65%, leaving them with 35% of their gross revenue to pay all the expenses of running a business. The way I look at it, take that $2.263 million and multiply it forward for four quarters to assess how much money relative to market cap they have to run the business and provide a return to shareholder. It comes to $9.05 million, about 12% of the market cap.

The expenses, $3.297 multiplied by 4 quarters, comes to $13.19 million, or about $4 million more than the than the cash flow. This business is earning -5.7%. They have a one time sale of an asset to make them look cash flow positive this quarter, but one time sale of assets does not continue in earnings. They are essentially seriously cash flow negative.

Read More......

Thursday, May 24, 2007

Income Trusts - Park Your Money Investments

A New Breed of Dividend Paying Companies featured a stock that failed to live up to my theory as to why dividend stocks tend to do better through market corrections -- that investors looking for dividends look for the highest paying dividends.

For the next few years in Canada earnings from income trusts are tax exempt if they are paid out as dividends. Some of these income trusts pay out an amazing dividend and have been overlooked by the market.

Income Trust Trader (ITT) has put together a list of what they call their Top 30 - Projected 1-Year Total Return. They project up to 175% return on some of these trusts, and even the lowest they project a 90% return.

So, I decided to have a quick look at these, as well as a few others that look promising. In the chart is today's price, the annual dividend, the dividend yield, the one year projected return on the ITT recommended stocks, and my calculation, which is purely math done with strong assumptions. I did not include any income trusts on their list currently paying under 7%.

Symbol
Price
Dividend
Yield ITT Projection My Calculation*
VNG.UN 5.55 1.02 18.38% N/A 148%
MPX.UN 8.29 1.28 15.38% 125% 108%
PGF.UN 20.09 3.00 14.93% N/A 102%
HTE.UN 31.32 4.56 14.56% N/A 97%
BSD.UN 9.80 1.40 14.29% 95% 93%
ESN.UN 7.09 1.00 14.07% 90% 90%
DOM.UN .87 .12 13.79% 99% 86%
CNE.UN 16.89 2.28 13.50% N/A 82%
CDI.UN 10.25 1.35 13.17% 96% 78%
AVN.UN 13.79 2.28 13.05% N/A 76%
FNA.UN 6.56 .85 12.96% 175% 75%
PVE.UN 12.58 1.44 11.45% N/A 55%
CEU.UN 8.60 .95 11.05% 140% 49%
RIG.UN 7.33 .80 10.97% 130% 48%
SPF.UN 14.79 1.56 10.55% 95% 42%
GDI.UN 10.80 1.08 10.00% 125% 35%
BDI.UN 10.45 1.00 9.57% 98% 29%
CJT.UN 12.81 1.16 9.03% 98% 22%
TRK.UN 11.23 1.00 8.90% 98% 20%
ICE.UN 11.59 1.00 8.63% 94% 16%
FDG.UN 30.60 2.60 8.50% 105% 15%
VOX.UN 13.25 1.10 8.30% 125% 12%
MTL.UN 22.05 1.80 8.16% 93% 10%
PEY.UN 20.75 1.68 8.10% N/A 9%
PGX.UN 15.25 1.20 7.87% 91% 6%
FIG.UN 16.75 1.28 7.62% 90% 3%
SSI.UN 19.10 1.44 7.54% 98% 2%
PKI.UN 16.39 1.16 7.08% 105% -4%
*The assumptions I've made is that these stocks will price themselves to an 8% dividend within a year, the dividend will remain constant and that these companies can all support the level of dividend they are paying -- none of that nonsense stuff like with "the new breed" company.

The formula I used is:
(Price*Yield/0.08 + Dividend)/Price - 1
The Price*Yield/0.08 gives the price the stock would be if investors priced it so the dividend yield would be 8%. Over the year you would also get the dividend, so that is added on. Dividing by Price gives what percent of the starting price the new price is. Subtracting 1 is taking 100% off for the original price of the stock.

So, for the first one, 5.55*.1838/.08 gives $12.75. Add the $1.02 dividend and you get 13.77. Divide by the 5.55 and you get 2.48 or the new price is 248% of the start price. Taking 1 off the 2.48 gives 1.48 or 148% gain.

The calculation I did was without consideration of the fundamentals behind the companies. Some may be forced to reduce their dividend and some may increase their dividend. Current price and dividend are the only two criteria used in my calculation and would hardly be considered due diligence, or something to bet the life savings on. Looking a combination of current dividend yield, my calculation, and ITT's projection gives a good start for stocks that could be worth holding.

Canadian income trusts also act as a currency hedge.

I picked 8% as a dividend yield. Once companies are taxed, you can expect the dividend to decline by 40%, or what ever tax rate the company ends up paying. That would bring the dividends down to about 5%, which is in line with reasonable dividend paying companies.

Examples of dividend yield of some companies:
  • NTE - 7%
  • QMAR - 4.9%
  • HBC - 3.7%
  • APSE - 2.9%
  • LYO - 2.5%
  • INTC - 2%
  • TFX - 1.7%
  • RCL - 1.4%
  • GG - 0.8%

Read More......

Monday, May 21, 2007

The Motley Fool

I play CAPS on the Motley Fool and I've read many of the articles they post on their site. I find they have some excellent investment tips and they have a goal of helping investors to become better investors.

My score for the CAPS game is below. You rate stocks to out perform or to under perform the S&P. You can also have a look and see how the better players choose stocks, and seeing how you aren't playing with real money, you can bet on stocks that you wouldn't touch in real life.


On the side of my blog I've put another one of their widget for 27 second stock pitch videos that various CAPS players have made. Some of them are quite entertaining. Check it out.

Read More......

Thompson Creek Metals - Ahead of itself?

Blue Pearl, aka Thompson Creek Metals, TCM-TSX, has made more than a few investors a lot of money. In the fall of 2005 the share price was at a low of $0.60. Today they have a share price of $16.63 for a whopping 2700% return.

Futher, they made 45c/eps in Q1/07. Extrapolate that by multiplying by 4 and add at least 10% for the price of molybdenum going up and you get a rough estimate for 2007 eps of about $2, or a P/E of about 8.3.

Their molybdenum production is 21 million pounds per year, increasing to 27 million pounds, and molybdenum prices are up at least 10%, so earning should go up, making this a buy right?

Wrong, very wrong, and here's why.


For this quarter where they report 45c eps commodity prices were so strong, in their opinion, they reduced their inventory levels and they sold 10.5 million pounds for the quarter, twice their level of guidance. They do not have the inventory levels to repeat this feat, so production sales for Q2-Q4, indeed until they build a new mine, should be about half of Q1.

Further, the US dollar is declining so their Canadian costs will go up, about 10% over last quarter just based on the recent strengthening of the Canadian dollar. That increase in molybdenum prices will offset some of the increased costs due to currency losses, but trying to make up for having half the sales simply isn't going to be covered by the increase in molybdenum price.

Then there is share dilution. They earned $47.7 million dollars, and that is over 105,395,000 shares diluted, so they calculated 45c/share. Currently they have 111,749,000 shares, 24,644,000 warrants and 6,943,000 options for fully diluted share capital of 143,336,000 shares, or about 36% more shares then reported. Average the earnings over the full dilution and you get 33c/eps. There will be a substantial difference between earnings and dilute earnings for Q2.

Thompson Creek metals, is highly unlikely to repeat its Q1 earnings for a very long time, and it isn't unrealistic to expect half the Q1 earnings for Q2.

Read More......

Friday, May 18, 2007

Goldcorp: The Oxymoron of Fiat Creation

Goldcorp has taught me a lot about what can be hidden in a stock. When I look at the dynamics of what drives a gold stock, the gross irony of Goldcorp is that, from my point of view, it is the epiphany of investor fears that is driving the gold bull in the first place.

So, just what are investor fears driving the gold market? The answer I get is currency devaluation due to government just printing more money. As the money supply grows, there is an escalation of inflation. The U.S. national debt is so enormous, printing money to pay bills seems more likely, so this is a serious and valid concern. Governments printing money is the cause of hyper-inflation.

Gold is supposed to be protective against this. Gold should hold its value against other currencies. This makes a certain amount of sense, however, gold stocks are not gold. They represent business that mines gold. They do not mine the gold and just sell enough to cover expenses and then save the hard asset that is supposed to protect valuation; no, they tend to sell all that they mine, paralleling the gold bug complaint that the gold that used to back currency has been sold off.

Gold companies do not print money, however, they do print stocks. Stocks are to a business what currency is to a country. If a business is printing stock, or issuing new equity, it is very comparable to government printing more money.

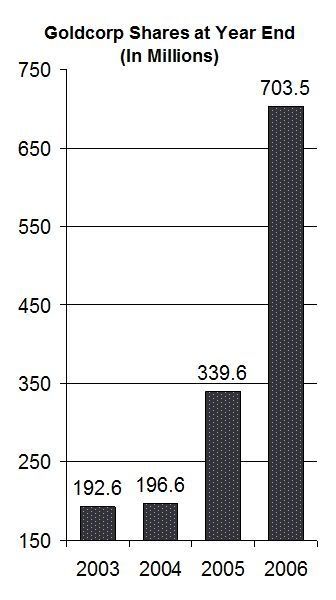
Just How Many Shares Has Goldcorp Printed?

The graph below show just how frivolous Goldcorp is with issuing new equity, options and warrants. Options and warrants are included and must be included to get a true picture of a company.

Photo Sharing and Video Hosting at Photobucket
If you owned say 1% of Goldcorp in 2003, well now you only own about 1/4 of one percent of the company.

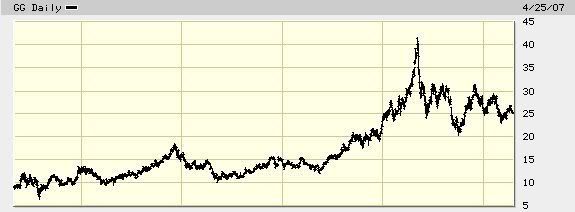
Dilution is easily hidden. It can be found, but it really doesn't show up in a chart of the company's performance, like this one on Goldcorp's share price:

Photo Sharing and Video Hosting at Photobucket

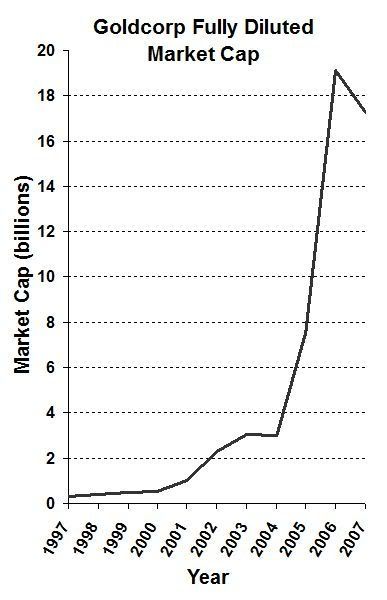
A chart of a company's share price completely and utterly hides dilution. To see a true picture of performance, you really need to look at a graph of fully diluted market cap. But where do you get that? As far as I can tell, it just doesn't exist, but it is probably one of the strongest pictures of how the market is valuing a stock.

There is no way that I can go back and figure out fully diluted share/warrant/option count on a daily basis and multiply it by the share price, but, I could do it for 10 points, say at the end of each year.
Photo Sharing and Video Hosting at Photobucket
The dilution thoroughly hides the gross escalation of market cap. Seriously, this looks more like the Zimbabwe exchange than a real investment. The share price and market cap graphs look nothing alike.

There were events tied to issuing of new equity. Some was to pay back debt, much like how governments have printed currency to pay back loans. Other events were asset acquisition, such as the take over of Glamis.

The midas touch, $6 billion of fiat book value in a single deal

Glamis was a gold producing company with a good development property. Their book value in their Q3 financial report before the takeover was $2.2 billion dollars. When Goldcorp took over Glamis the cash and equity value of what they issued was $8.2 billion dollars, and Goldcorp now carries $8.2 billion dollars in assets on their books for the Glamis properties.

Essentially, Goldcorp has a hyper-inflation of asset valuation being carried on their books. As assets are mined from the ground, an appropriate allocation of book value for each mine is written off.

The hyper-inflated Glamis assets are currently mostly non-producing assets, so what is currently written down is tiny compared to the total asset picture of Goldcorp, and it is tiny compared to the relative book value that the company is carrying for all of its properties. Once these assets start producing the writing down of the fair allocation of book value of these hyper-inflated assets will implode earnings.


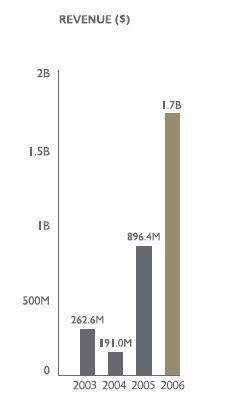
I find that Goldcorp is masterful at taking the focus from what ought to be the first priority for investors and and spinning impotent results into a good story. For example, look at the graph of revenue. It tells a stellar growth story, but merely looking back at the total share count suggests the revenue growth is inadequate compared to the equity growth.

Photo Sharing and Video Hosting at Photobucket


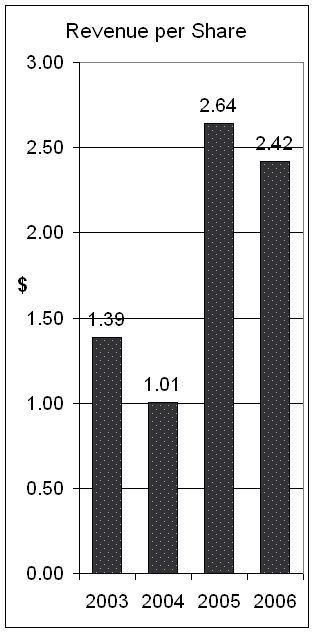
Indeed, the revenue per share has actually declined.


Photo Sharing and Video Hosting at Photobucket

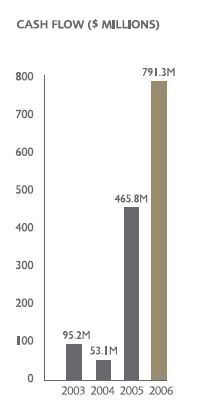
Goldcorp also printed a pretty cash flow chart, again in total cash flow, and again, a pretty picture.

Photo Sharing and Video Hosting at Photobucket


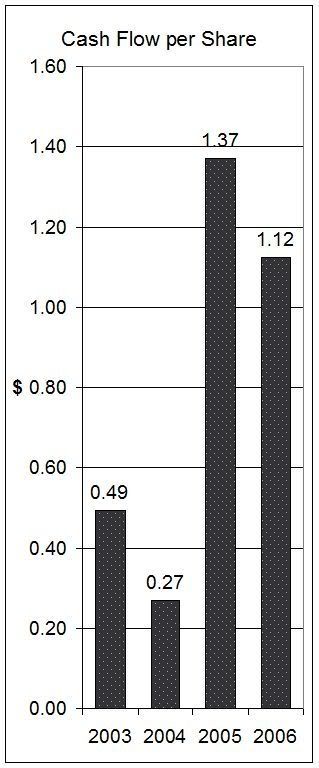
But again, the per share picture isn't so pretty, it is actually down 22%.

Photo Sharing and Video Hosting at Photobucket


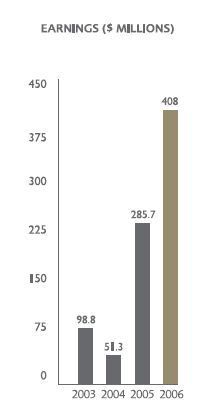
But not to be disuaded, I decided to look at the next "Go Goldcorp!" graph, which was earnings, and again, their presentation looks stellar.


Photo Sharing and Video Hosting at Photobucket


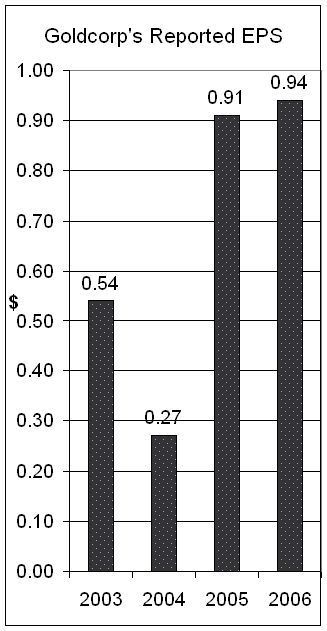
When you use Goldcorp's numbers for individual shareholders, it actually does look like an improvement.


Photo Sharing and Video Hosting at Photobucket


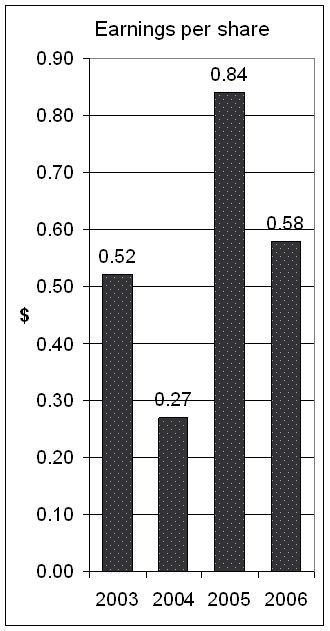
But I check calculations for myself I found $408 million in earnings when there were 703.5 million shares fully diluted did not "add" up to what they report. Practically none of the effects of share dilution and fiat book value from the Glamis merger show up in the financial reports. I took the earnings and the fully diluted share count at year end and re-plotted the data. This is ultimately what share holders are getting.

Photo Sharing and Video Hosting at Photobucket

In 2003 with 52c eps Goldcorp was trading under $16.

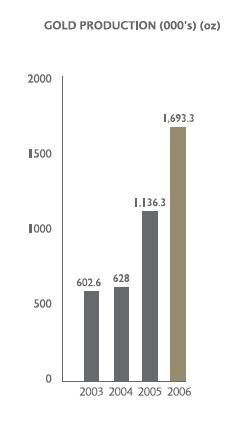
Goldcorp also puts its spin on gold production based on ounces for the company as a whole.

Photo Sharing and Video Hosting at Photobucket


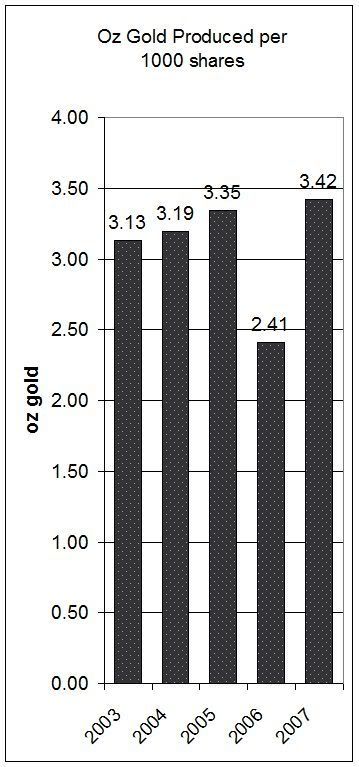
But, what Goldcorp is producing per share is far more important. The graph below is actually per 1000 shares, and the 2007 point is projected production. Already for 2007 production has been down graded twice from 2.8 million ounces.

Photo Sharing and Video Hosting at Photobucket

The 2006 figure has totally imploded. With about $24,000 US investment you can expect to see about 2.4 ounces of gold produced. It begs the question, how can anyone possibly think that this is reasonable? If they meet their targets for 2007, the gold production per share will return to the historical levels.

Even looking at Goldcorp's Q1 financial reports you can see how they steer investors from looking at what is important in terms of their individual share ownership and direct them to the big picture of a company that is under performing on a per share basis relative to prior years. Eps for Q1 this year compared to Q1 last year were way down, but they report stellar improvement.

All in all, Goldcorp belongs to the honor role for the frivolous cap of fiat creation.

Read More......

Sunday, May 06, 2007

Low Interest Rates - As Destructive as Usury?

I was 17 when I first got a job as a teller in a credit union in 1979. This is where I first studied mortgages.

Qualifying income was such that no more than 30% of your gross income would be needed to pay the mortgage. Mortgage rates were about 10-12%. You needed qualifying income of $36,345 to qualify for $100,000 of mortgage at 10%. Most mortgages at the time were under $50,000, and people in their 30s were paying off their mortgage on their house, not a condo or a townhouse, but a house with a yard.

The credit unions had technology far ahead of the times and they had a program where I could change the variables in mortgages and view amortization tables, much like you can do today.

The changes intrigued me. I studied how much money a person could save by increasing their payments by relatively small amounts. For example, at 10% the payments on $100,000 mortgage would be about $909 per month over 25 years, and 10% was about what mortgage rates were before they spiked. Increase the payment by 10% and you would have saved 7 years, or 28% of your payments. The table below shows what happens with each 10% increase in payment.

Effects on Amortization Period of increasing payments at a fixed rate of 10%

Example A: $100,000 @ 10%
Payment Amort (months)
Months Reduced (+/- 0.5 months)
Increase in Payment - (total)
Decrease in Months to Repay - (total)
Total Interest Paid
Interest saved from last 10%*
$908.62 300 N/A
N/A N/A $172,600
N/A
$999.48 216 84
10% - (10)
28% - (28)
$115,900
$56,700
$1090.34 174 42
10% - (20)
14% - (42)
$89,700
$26,200
$1181.21 147 27
10% - (30)
9% - (51)
$73,600
$16,100
$1272.07 128 19
10% - (40)
6.3% - (57.3)
$62,800
$10,800
$1362.93
114
14
10% - (50)
4.7% - (62)
$55,400
$7,400
$1453.79
102.5
11.5
10% - (60)
3.8% - (65.8)
$49,000
$6,400
$1544.65
93.5
9
10% - (70)
3% - (68.8)
$44,400
$4,600
$1635.52
86
7.5
10% - (80)
2.5% - (71.3)
$40,700
$3,700
$1726.38
79.5
6.5
10% - (90)
2.2% - (73.5)
$37,200
$3,500
$1817.24
74
5.5
10% - (100)
1.8% - (75.3)
$34,500
$2,700
*As number of payments have been averaged to +/- 0.5 of a payment, the error in the total interest can be as much as +/- 0.25 of the payment.

The leverage of how much you could save rapidly declined as you increased payments. Where that first 10% increase brought the number of years from 25 down to 18, increasing by 20% saved an additional 3.5 years, or 14%. By increasing payments by 30%, the number of years to pay back the mortgage was cut by more than half.

Furthermore, the interest saved with that first 10% increase is enormous, 56.7% of the original mortgage amount -- about 1/3rd of the interest overall. And even more amazing, double the payment and you pay only about 1/5th the interest and can pay it off in a little over 6 years.

Effects on Payments of changing interest rates for fixed amortization

Example B: $100,000 over 300 months
Interest Rate Change in Interest Rate
PaymentIncrease/ Decrease
% Change in Payment
9%
-10%
839.14
-69.48
7.65%
9.5% -5%
873.62 -35.00
3.85%
10% 0%
908.62 0
0%
10.5% 5%
944.0935.47
3.9%
11% 10%
980.0171.39
7.86%

At those interest rates, 0.5% changes did not make huge differences to payments. When 10% is the current mortgage rate, a 1% decline or increase means the interest rate has changed by 10% (change in rate/rate*100%). The relative payment changes by less than the change in the interest rate. Interest rate increases cost more, but are manageable.

If you look at percent of that family income, a 1% increase would cost 2.36% of qualifying income. For most households income would have increased by at least that amount by the time a mortgage needed to be renewed.


Something not shown on the table is that if interest rates went down by 1%, and you kept your payment the same, the amortization would decline to 19.5 years, and you did not give up an ounce of lifestyle. If interest rates cut in half, to 5%, the amortization would decrease to 12.25 years.

The other thing I "played" with was how much would you have to change the payment to reduce amortization by a year at a time?

Effect on Payment of Reducing Amortization Period

Example C: $100,000 @ 10%
Amort (years) Monthly Payment ($)
Increase to reduce 1 year ($)
Total increase ($)
% Total increase
Total Interest Paid ($)
25 908.70 N/A N/AN/A
172,610
24 917.39 8.69 8.690.96%
164,208
23 927.18 9.79 18.482.03%
155,902
22 938.25 11.07 29.553.25%
147,697
21 950.78 12.53 42.084.63%
139,597
20 965.02 14.24 56.326.20%
131,605
19 981.26 16.24 72.567.99%
123,727
18 999.84 18.58 91.1410.0%
115,966
17 1021.21 21.37 112.5112.4%
108,327
16 1045.90 24.69 137.2015.1%
100,813
15 1074.61 28.71 165.9118.3%
93,429
14 1108.20 33.59 199.5022.0%
86,178
13
1147.85
39.65
239.15
26.3%
79,064
12
1195.08
47.23
286.38
31.5%
72,091
11
1251.99
56.91
343.29
37.8%
65,262
10
1321.51
69.52
412.81
45.4%
58,581

When interest rates were 10% small changes to a family's overall budget to increase mortgage payments brought in enormous financial reward in terms of reducing the number of years to pay back the debt - - it explains how the economic conditions enabled so many people to be paying off their mortgage in their 30s.

For simplicity, $100,000 was used, but when I first started working in the bank few mortgages were over $50,000 and I remember we were shocked when someone applied for and took out a $100,000 mortgage!

I worked in the banks through the period that interest rates doubled. There were two groups of homeowners, those that had gotten into the market recently and those who had been homeowners for a while.

It certainly made things harder for those who had been home owners for a while, but few lost their homes. For most, income had dramatically increased through the 70s, so although it hurt for that renewal period, wages had kept up enough to enable them to keep their homes.

Many who recently bought found themselves over extended and with insufficient income to cover the huge increase in mortgage payment. In Vancouver it was complicated by a housing price bubble. People who bought at the high point lost their homes, their down payments, and in some cases stilled owed money after the home was sold. In retrospect, the lucky ones failed to qualify for a mortgage.


The usurious interest rates were hard, and very, very destructive for some.

Low Interest Destructive?


Low interest rates have been looked at as a good thing for homeowners, but I beg a difference.

No question that if you owned your home, had a mortgage and interest rates decline, you gain, or if you live in a region with emigration. But what happened if you did not own your own home before interest rates declined, live in a region with population growth, and interest rate went down to 4%? First one must compare what changes on low interest rate mortgages look like.

Effects on Amortization Period of increasing payments at a fixed rate of 4%

Example D: $100,000 @ 4%
Payment Amort (months)
Months Reduced (+/- 0.5 months)
Increase in Payment - (total)
Decrease in Months to Repay - (total)
Total Interest Paid
Interest saved from last 10%
$527.84 300 N/A
N/A N/A $58,351
N/A
$580.62 257 43
10% - (10)
14.3% - (14.3)
$48,925
$9,426
$633.41 225 32
10% - (20)
10.7% - (25)
$42,199
$6726
$686.19 200 25
10% - (30)
8.3% - (33.3)
$37,142
$5,057
$738.98 181 19
10% - (40)
6.3% - (39.7)
$33,191
$3,951
$791.76
165
16
10% - (50)
5.3% - (45)
$30,016
$3,175
$844.54
151
14
10% - (60)
4.7% - (49.7)
$27,405
$2,611
$897.33
140
11
10% - (70)
3.7% - (53.3)
$25,218
$2,187
$950.11
130
10
10% - (80)
3.3% - (56.7)
$23,360
$1,858
$1002.90
122
8
10% - (90)
2.7% - (59.3)
$21,761
$1,599
$1055.68
115
7
10% - (100)
1.3% - (60.7)
$20,369
$1,394

There is no question that increasing payments reduces the interest to be paid back, but the benefit of increasing that first 10% increase in payment is about half of what it was as a percent in example A, and look at the difference in overall interest savings, $56,700 versus $9,400, about 600% more savings in interest. The leverage of what you can do to improve your economic position by increasing payments and paying is severely compromised when interest rates are low.

Doubling payments resulted in reducing the amortization to 74 months or 6 years and 2 months, but at 4% interest doubling only reduces the amortization to 115 months or 9 years and 7 months. With low interest rates when you double your payment you have to pay for an extra 41 months or 55% longer to pay off the mortgage.

Effects on Payments of changing interest rates for fixed amortization

Example E: $100,000 over 300 months
Interest Rate Change in Interest Rate
PaymentIncrease/ Decrease
% Change in Payment
3%
-25%
474.21
-53.63
10.16%
3.5% -12.5%
500.62 -27.22
5.16%
4% 0%
527.84 0
0%
4.5% 12.5%
555.8327.99
5.30%
5% 25%
584.5956.76
10.75%

The one percent increase from 4% to 5% results in the payment going up 10.8% when interest rates are low compared to 7.8% when interest rates are higher. Overall, that comes to about 3.24% of qualifying income. It does not sound like a lot, but compared to the 2.36% in example B, the overall relative increase is 37% more.

If interest rates go down to 3% and you keep your payment the same the amortization would decline to 21 years 5 months, 35% less benefit than when when interest rates were higher.

Effect on Payment of Reducing Amortization Period

Example F: $100,000 @ 4%
Amort (years) Monthly Payment ($)
Increase to reduce 1 year ($)
Total increase ($)
% Total increase
Total Interest Paid ($)
25 527.84 N/A N/AN/A
58,351
24 540.69 12.85
12.85
2.43%
55,719
23 554.75 14.06
26.91
5.10%
53,111
22 570.18 15.52
42.43
8.02%
50,527
21 587.18 16.91
59.34
11.2%
47,969
20 605.98 18.80
78.14
14.8%
45,435
19 626.87 20.89
99.03
18.8%
42,926
18 650.20 23.33
122.36
23.2%
40,443
17 676.39 26.19
148.55
28.1%
37,984
16 706.00 29.61
178.16
33.8%
35,551
15 739.69 33.69
211.85
40.1%
33,144
14 778.35 38.66
250.51
47.5%
30,762
13
823.12
44.77
295.28
55.9%
28,406
12
875.53
52.41
347.69
65.9%
26,076
11
937.67
62.14
409.83
77.6%
23,772
10
1012.45
74.78
484.61
91.8%
21,494

In the last example, to reduce the amortization period by one year you must increase the payment by 2.43%. Overall, this is an enormous difference in comparison to example C where the payment was increased by 0.96%, relatively speaking about 2.5 times as much.

The big difference is to look at the change for paying back the mortgage in 10 years. In example C if you increase the payment by 45.4% the mortgage is paid off in 10 years, where as when rates are 4% the payment has to be increased by 91.8%.

Enter Housing Costs

On the surface, lower interest rates look like win-win. On $100,000 payments start at 58% of what payments were at 10% interest, and that is an enormous savings. However, the big problem is that in many cities housing costs have increased far beyond the rate of inflation, to the point that people buying are often qualifying for their mortgage with the same parameters as those that first bought when mortgages were 10%.

There are tons of examples that could be used, but I will use what I know. In 1976, after my mother passed away, her two bedroom condo in Kitsilano lay fallow for more than a year for not being able to sell it for about $30k. In that over a year period it ate all of the equity she had built into it as well as the equity of her 3-year-old car. Indeed, when the bank foreclosed on it, her estate owed more than it had. So, $30k for a two bedroom condo in 1977 is what I know to be true.

Today the cheapest two bedroom condo I could find is priced at $379k. This represents an annual rate of return of 8.8% over the past 30 years. Minimum wage at the time was $3/hour. To put it into perspective, if minimum wage had kept up with the increase in housing cost for that period, minimum wage would be about $40/hour, but that's another issue.

To keep things simple, I'll ignore down payments, maintenance fees, property tax, etc. and just do a comparison on the two condo values.

To qualify for 30k at 10% you would have needed about $11,000 of income, or a wage of $5.64/hour. Monthly payments would be $272.61. Total amount paid would be $81,783. Interest is 63.3% of the repayment amount.

To qualify for 379k at 4% you would need $80,000 of income, or a wage of $41.03. Monthly payments would be $2,000.50. Total amount paid would be $600,150. Interest is 36.8% of the total.

On a side note, something that is utterly amazing about this to me is in 1977, as a 15-year-old, I worked part-time as a waitress and with tips I was making about $6/hour. I wonder how many 15-year-olds today could get a part-time job that would pay them $40-45/hour? In light of this enormous economic difference, no wonder so many 30 something year olds were able to pay off their mortgage!

Principal must be repaid, interest repayment is flexible

Ignoring the gross decline in wages relative to housing costs, a serious difference in the two examples is the amount of interest in the payments. By comparison, today's new buyer is grossly under privileged in their ability to get ahead by accelerating payments because the majority of the amount to be repaid is principal. When the majority was interest, that repayment could be drastically reduced by modest compromises in lifestyle.

I would further suggest that had interest rates remained higher, housing prices would be lower because less people would qualify for mortgages, and housing prices are determined by supply and demand.

So had interest rates only declined to 7% that 35-year-old $379,000 condo might be for sale for $283,000, a price that would also require $80,000 of income if interest rates were 7%, only in this case 53% would be interest. The increase in the price of the condo would still be way ahead of inflation at 7.7% per year.

If interest rates had remain in the 10% range one would only qualify for $221,000 with $80,000 of income and 63.3% of the repayment would be interest, and rate of increase in the price of the condo would be 6.9%.

Low interests rates have enabled housing prices to increase beyond reasonable levels and drastically reduced a new home owner's ability to reduce their repayment burden as most of the amount to repay is now principal.

Low interest is a function of inflation

Probably the most important disabling point for newer buyers is that low interest rates are a function of inflation. Low interest rates mean inflation is lower, which means wage increases are lower. When interest rates were high home owners could count on wage increases of 5-8% and the housing burden in their budget rapidly declined, enabling them to make far more discretionary income decisions. With low interest rates inflation is low and wage go up slowly. Indeed, many workers have experienced years with no wage increase. Increasing repayment of mortgage debt is not so easy when wages remain relatively flat.

So, Are Low Interest Rates as Destructive as Usury?

The usurious interest rates cost most people a couple hard years. Newer buyers will have a lifetime of hard years repaying their mortgages because flat wages disables them from being able to increase payments very much, if at all, and since most of the repayment amount is principal there is little power to improve financial position from leverage of increased payments. Furthermore, it isn't likely that new home owners will enjoy wealth creating due to appreciation of their home values. They have significant downside risk.

Very few who had been a home owner over 3 years lost their home from usurious interest rates of the early 80s. Housing prices doubled from the late 70s to the early 80s and it was the ones who paid the high prices who lost their homes and were left with massive debt to repay, the rest had to tighten their belts and deal with loss of lifestyle.

So, it depends on who you ask. There is no question they were a boom for people in the housing market early and that today's buyers will never enjoy the wealth creation it gave to generations before.

Read More......