Showing posts with label gold bubble. Show all posts

Saturday, August 25, 2007

Declining grade of Gold – Are the cost disadvantages linear?

This is an analysis that I have been meaning to do for a while that simply looks at how mining a declining ore grade affects costs. This is a particularly important analysis for investors of gold stocks as my sense of the market is that the grades of gold being mined are declining faster than any other commodity, and additionally, replacement reserves for gold companies are grossly lower quality than reserves that are currently being mined.

The markets were awful while I was away on vacation, and some of the market fears from the subprime mortgage market spilled over into commodities. These fears as well as fears of stagflation or hyper-inflation are part of what is driving gold prices and gold stocks. The idea is that gold will hold wealth better than paper currency that is simply printed at will.

Figuring out what gold bullion is “worth” is very easy, just go to Kitco.com. If you think the price of gold will double, well, just buy the bullion and your investment will double.

Figuring out what a gold stock is “worth” is a very complicated thing and nothing about how a company is run is in your control. Proper evaluation of a gold stock requires an enormous amount of time. A simple linear extrapolation that if they double production they double earnings is proving to be false due to increases in costs that would be best described as a hyperinflation of costs, as in the Goldcorp 2004 project of costs for 2006 of $70/oz that ended up 179% higher at $195/oz. Gold stocks also have a propensity to issue equity at will, highly diluting wealth as well.

My suspicions are that gold producers are mining off their higher grades at a rate that leaves drastically reduced grades left to be mined and they have drastically lower grades in replacement properties so new mines do not have any chance of coming close to the profitability of historical mines despite higher gold prices.

The question I want to answer is how does the declining grade affect costs. I suspect that costs do not increase linearly with declining grade, but exponentially and if I am correct, many investors are going to find themselves in serious trouble with their gold stock investments, even if the price of gold doubles.

As the purpose of this investigation is to simply understand what happens to costs when all things are equal except the grade declining, I will make some very simple assumptions. First, assume there is a part of the processing linked to the cost of grinding the ore and extracting the gold. For this analysis assume the cost is fixed per ton of ore. I will assume a cost of $25/ton of ore, as you might have for an open pit operation. At the end of this will be a gold concentrate that requires more processing to extract the pure gold. The second part of the process assumes a fixed cost per ounce of gold. I will assume a fixed cost of $10/oz of gold.

Further, I will look at how a 0.5 g/ton decline affects costs from 100 g/ton down to 1 g/ton. The last assumption will be that 32 grams of gold must be extracted to get one ounce of gold. Recovery is never 100% and using this number works out to 97% recovery. My educated guess as a chemist is that the overall percent recovery would also decline with declining grade, so more than likely this analysis will understate the increasing costs with grade.

I set up a simple spread sheet at http://spreadsheets.google.com/pub?key=pHy7hQjBLOcqL73eztsvRaQ. It shows that with the costs used a half-gram decline in grade when the grade is over 30g/ton is utterly marginal to costs. The follow graph is the percent increase in cost as the grade increases.
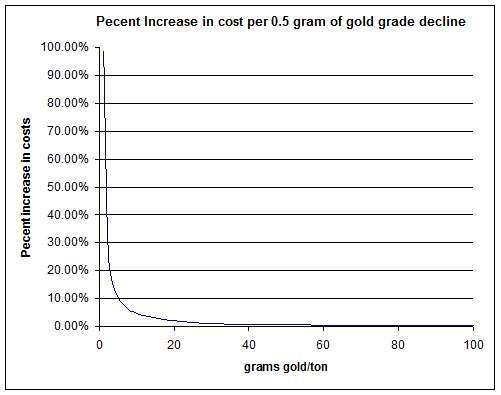
Photo Sharing and Video Hosting at Photobucket

This graph demonstrates beyond my wildest expectations that costs hyper-inflate for low grades of ore. The prices I used would be for a low cost open pit operation. The graph does not explain how Goldcorp’s projected costs ended up being 179% higher over a two-year period.

When I put a cost of $175/ton of ore for processing for underground mining my model gives costs of $80/oz when the grade is 79.5g/ton, reasonably close to Goldcorp’s $80/oz when they were mining a grade of 77g/ton. At 30g/ton the model gives a cost of $187/oz, very close to the $195/oz they had around that grade. Interestingly, the model shows that it would cost $5,600/oz to mine underground grades of 1g/ton, and double that, $11,200, for a grade 0.5g/ton.

This is a very simple model, but the lesson it shows is something that every gold investor ought to understand. Below is the graph reproduced for grades 6 grams and less, showing the increased percentage cost for a grade decline of 0.5g/ton, and I reversed the director of the x-axis so you can see the out of control, concave up, shape of the curve.
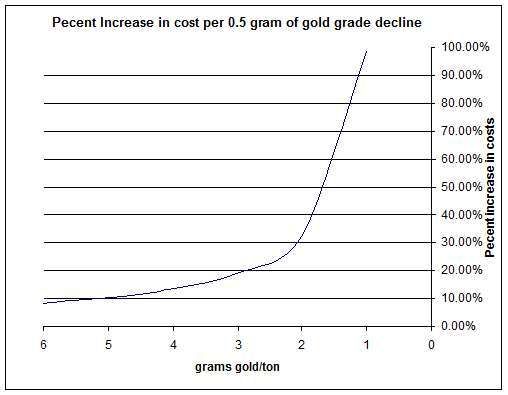
Photo Sharing and Video Hosting at Photobucket

This graph should have investors of companies with low-grade reserves feeling utterly ill. I would suggest that what it means is that anyone signing their name saying that a low-grade reserve is economically viable is either incompetent, unethical or they think investors are truly gullible and stupid.

I have worked as a chemist in a lab and the entire economic viability of the feasibility study rests on the accuracy and extrapolation of the assay results. The lab I worked in we used to regularly send out samples to other labs as a crosscheck on our results and there would typically be up to a 30% variation in results. To test where the problem in results lay, I sent out duplicate samples labelled differently and carefully prepared and tested standards and the results returned were out by 30%.

This graph is showing that when grade declines from 6g/ton to 5.5g/ton, costs increase by almost 10%. A half-gram decline at 3g/ton has cost increases of about 20%. At 2g/ton the same decline results in a 30% increase in costs, and at 1g/ton the decline results in about a 100% increase in costs. When you consider the potential error in assay results, the margin of error in these feasibility studies on low-grade deposits is potentially so enormous; these kinds of investments simply are not investments, but truly a form of gambling.

Conclusion:

The cost increases in low-grade deposits are not linear, but exponential and imitate a hyperinflation of costs as grade declines. In high-grade deposits errors in feasibility studies due to errors in grade or small declines in grade are relatively small and have a minor effect on investment decisions. Feasibility studies on low-grade deposits are highly suspected for huge errors due to the grossly different economics of low-grade deposits from small errors in assumptions and data. Using these studies for investment decisions resembles gambling more than investing.

Read More......

Saturday, June 30, 2007

Yamana, Northern Orion, and Meridian Gold Merger

Northern Orion first got my attention last fall when it was trading at about $4 Canadian at the beginning of October 2006, and given its under valuation, the upward march in October made sense. Then it gradually declined, again touching just under the $4 mark at the beginning of January.

It was during that descent that I started to contrast how it was being valued relatively in the market to ensure my perspective was reasonable and because of the joint ownership of the Alumbrera mine, Goldcorp was the most logical company to contrast relative valuations. The result was How I discovered the Gold Bubble and I came to the conclusion that Northern OrionLoading... was a buy to $7 based on its property holdings.

Wednesday’s joint news release announces a proposal to merger between Yamana Gold, and Northern OrionLoading... with an offer for Meridian Gold to be a part of the deal. The effective price for Northern OrionLoading... is $7.07 per share, a 21.3% premium over the day’s closing price, the same valuation that I came up with for Northern OrionLoading... without development of the Auga Rica property.

Northern Orion also has two types of warrants. The regular warrant holders closed at $4/share on Wednesday, so with an exercise price of $2, they have a 27% premium on the close, and still have until May 29, 2008 to exercise their warrants. The A warrants were not “in the money” warrants. They are exercisable until February 17, 2010. If Northern Orion managed to get their Auga Rica property developed in time for the A warrants, the roughly 600% growth in production meant that those out of the money warrants had a potentially very nice risk-reward ratio. The A warrants transfer to buy 0.543 of a Yamana share for $6. It means that Yamana’s share value must increase to $14.42, or $1.40 over the $13.02 close, in order for the A warrants to be in the money at their $1.83 price. Without this offer Northern Orion’s share price would have to increase $2 to $7.83 for the A warrants to be in the money. Relatively speaking, before the deal Northern Orion’s shares had to increase 34% to break even and at the time of the press release Yamana’s shares have to increase by 11% to break even.

But, that was before today’s Yamana’s share price declined. With the decline to $11.83 the take-over price works out to $6.42 for Northern Orion, and for the A warrants the Yamana share price needs to increase 23% to $14.54 to be in the money from today’s $1.90 close.

Before any merger fully diluted Yamana Gold has 381.9 million shares. The merge adds 309.4 million shares for shares and if all Northern Orion warrants and options were exercised, another 37.5 million. A real plus for Meridan Gold is they state they’ve only had 36% stock dilution compared to an average of 417% among their peers since 2000. There appears to be only an extra 820,830 options, so very little dilution. If all options were exercised there would be an additional 1.8 million shares, for a total of 730.6 million shares. Going with Wednesday’s close of $13.02, that would give a fully diluted market cap of $9.5 billion, which has declined to $8.6 billion with today’s price decline.

Production

So, putting together the total of the three company’s production, and you have:

Northern Orion

  • Alumbrera, Argentina, about 50 million pounds of copper, 75,000 oz gold
Northern Orion can expect about $160 million of gross revenue, Q1 gross sales were $34.8 million. The royalty that kicked last year is costing 96c/lb of copper for Q1.

Meridian Gold
  • Rossi/Storm JV, Nevada, 25,000 oz gold for 2007, 30-40,000 oz for 2008
  • El Penon, Chili, 230,000 oz gold, 6 million oz silver
  • Minera Florida, Chili, 70,000 oz gold
  • Zinc production, 8 million pounds, my estimate from Q1 financial report
Meridian Gold can expect about $300 million gross revenue, Q1 gross sales were $66.4 million.
Yamana
  • 600,000 oz gold, 140 million pounds of copper.
Yamana can expect about $840 million gross revenue, Q1’s gross were $145.1 million.
Combined production is about 1 million ounces gold, 6 million ounces silver, 8 million pounds zinc and 190 million pounds of copper. At $650/oz for gold, $12.50/oz for silver, $1.50/lb for zinc and $3.20/lb for copper it gives about $1.3 billion in gross sales without hedges.
Q1 earnings were $27.4 million for Yamana, $9.5 million for Northern Orion, and $18.9 million for Meridian Gold, or $55.8 million.
Quality of Reserves
Grade quality of reserves and resources must also be considered.
Yamana
At December 2006 Yamana had 6.9 million ounces of gold at 0.49 g/ton, or metal values of $10/ton. Additionally there is 2.3 billion pounds of copper at 0.35% or about $25/ton. As some of the copper metal values overlap with the gold, weighted average metal values of copper and gold combined work out to $28/ton. The 13.7 million ounce of gold and 2.8 billion pounds of copper in the mineral resource has smaller average metal values, about $23/ton.
If you could master 100% recovery, at these grades you need to mine over 63 tonnes of ore to produce a single ounce of gold with 0.49 g/ton. Chances are they have higher grade veins to mine first, but the sheer magnitude of the amount of ore per ounce of gold suggests high production costs, or grossly increasing production costs as the grade mined declines.
To put it into perspective, the Chapada property has both the copper and gold and its metal values work out to $37/ton in the proven reserves and $30/ton in the probable reserves, essentially a 20% decline in metal values as the mine life proceeds and they move from mining the proven reserves to the probable reserves. At 0.34 g/ton 92 tonnes of ore must be mined for an ounce of gold. Take the grade down to the 0.26 g/ton and you need 120 tonnes of ore. Compounding this problem is that recovery rates also tend to decline as the grade declines, so where you might have had 90% recovery, you now have 80 or 85% recovery, the 92 tonnes required becomes 102 tonnes required at 90% recovery and the 120 tonnes required becomes 142 tonnes at 85% recovery.
You can take copper production and take those dollars and apply them to gold production and give the appearance of low cost gold production, but what you’ve essentially done is allow copper production to trade at gold multiples. With Q1/07 dilute earnings of 7c/share multiplied forward by 4 quarters you get 28c/share. That gives a P/E of 46, so copper sales are trading at a P/E multiple of 46.
Looking further, for Q1 the Chapada mine produced 38,954 oz gold and 27.5 million pounds of copper. That is about 32% of the gold production. Chapada was responsible for 60.6% of the net revenue, which leveraged to 87.4% of the operating earnings. That detail screams that the other mines are not making much money. For Q1 the grade mined at Chapada was 0.57 g/ton gold and 0.47% copper, the metal values per tonne mined were $45/ton, way more than the $37/ton metal values for the remainder of the proven reserves, and the $30/ton of the probable reserves.
Northern Orion
Alumbrera has a life of mine until 2016 and has 0.45% copper, 0.014% molybdenum and 0.47g/ton of gold for metal values of about $51/ton. Alumbrera has a 20% royalty that kicked in last year.
Agua Rica has reserves of 0.50% copper, 0.033% molybdenum and 0.23g/ton gold for metal values of about $61/ton. The Agua reserve has 8 billion pounds contained copper, 531 million pounds molybdenum and 5.4 million ounces of gold.
Meridian Gold
Meridian’s El Penon is stellar, 6.6 g/ton of gold and 275 g/ton of silver in the proven and probable reserves. At $640/oz for gold and $12/oz for silver, that’s a very nice $242/ton in metal values.
Minera Florida has 1.5% zinc, 27 g/ton silver and 5.3 g/ton gold for $169/ton metal values.
Rossi has a resource grade of 15.4 g/ton of gold for $317/ton, but the deposit is very small.
Esquel is has a stellar grade of 23g/ton of silver and 15g/ton of gold for $317/ton.
Of the three, Meridian Gold has the smallest reserve/resource contribution, but it has more profitable grades, even for the more costly underground mining.
The Growth Profile
Checking out their presentation, the two-year plan is to move from 1 million ounces of production this year to 1.5 million ounce by 2009, or a 50% increase in gold production. Say gold is $650/oz, that’s an extra $325 million/year of gross revenue. A move from 1 million ounces to 1.5 million ounces would only increase the gross revenue by about 25% as about half the revenue is from the zinc, copper and silver. There may be plans to increase production of these metals, but that information was not included in their presentation.
The increased production plan does not include developing Agua Rica, or Esquel. Agua Rica has a feasibility study to produce 365 million pounds of copper, 125,000 oz of gold and 16 million pounds of molybdenum. Say copper was $2/lb and molybdenum was $15/lb and gold $700/oz, that would give $1 billion of gross revenue. There would be no outrageous 96c/lb royalty on this production. There could also be the option of partnering with Alumbrera for some other kind of production arrangements as they are close together.
Conclusion
Just because you label a company a gold producer or a base metal producer is not justification to accept different valuations for producing an identical product, such as copper, silver and zinc and for Yamana the market is grossly overvaluing production from producing these metals in comparison to if they’d been produced by say, Quadra.
Also, the market tends to fail to adjust valuation for reserves based on the quality of the reserves. The low metal values per ton for Yamana suggest that the reserves should be valued at a significant discount when you consider that the mining costs per ton tend to be fairly fixed costs. When grades are $50/ton, $10 processing per ton is 20%. At $25/ton it is 40%.
The gold grades are low and the actual production costs without metals credits are high. When Chapada’s costs are fairly allocated between copper and gold you get 66c/lb production costs for copper and $187/oz for gold.
Yamana is sufficiently overvalued that the “premium” offered to Northern Orionand Meridian is completely fiat.
Do your own due diligence, these are strictly my opinions. For the record, I owned Northern Orion until I realized it could very well be taken over by some bubble-valued gold producer.

Read More......

Friday, May 18, 2007

Goldcorp: The Oxymoron of Fiat Creation

Goldcorp has taught me a lot about what can be hidden in a stock. When I look at the dynamics of what drives a gold stock, the gross irony of Goldcorp is that, from my point of view, it is the epiphany of investor fears that is driving the gold bull in the first place.

So, just what are investor fears driving the gold market? The answer I get is currency devaluation due to government just printing more money. As the money supply grows, there is an escalation of inflation. The U.S. national debt is so enormous, printing money to pay bills seems more likely, so this is a serious and valid concern. Governments printing money is the cause of hyper-inflation.

Gold is supposed to be protective against this. Gold should hold its value against other currencies. This makes a certain amount of sense, however, gold stocks are not gold. They represent business that mines gold. They do not mine the gold and just sell enough to cover expenses and then save the hard asset that is supposed to protect valuation; no, they tend to sell all that they mine, paralleling the gold bug complaint that the gold that used to back currency has been sold off.

Gold companies do not print money, however, they do print stocks. Stocks are to a business what currency is to a country. If a business is printing stock, or issuing new equity, it is very comparable to government printing more money.

Just How Many Shares Has Goldcorp Printed?

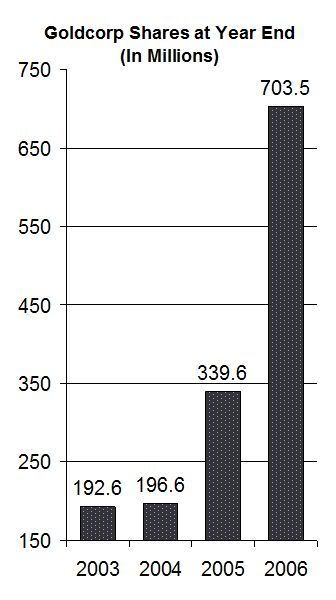
The graph below show just how frivolous Goldcorp is with issuing new equity, options and warrants. Options and warrants are included and must be included to get a true picture of a company.

Photo Sharing and Video Hosting at Photobucket
If you owned say 1% of Goldcorp in 2003, well now you only own about 1/4 of one percent of the company.

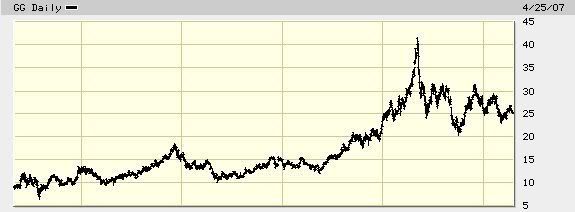
Dilution is easily hidden. It can be found, but it really doesn't show up in a chart of the company's performance, like this one on Goldcorp's share price:

Photo Sharing and Video Hosting at Photobucket

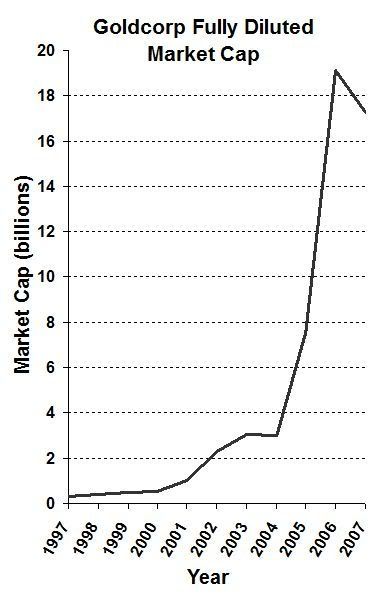
A chart of a company's share price completely and utterly hides dilution. To see a true picture of performance, you really need to look at a graph of fully diluted market cap. But where do you get that? As far as I can tell, it just doesn't exist, but it is probably one of the strongest pictures of how the market is valuing a stock.

There is no way that I can go back and figure out fully diluted share/warrant/option count on a daily basis and multiply it by the share price, but, I could do it for 10 points, say at the end of each year.
Photo Sharing and Video Hosting at Photobucket
The dilution thoroughly hides the gross escalation of market cap. Seriously, this looks more like the Zimbabwe exchange than a real investment. The share price and market cap graphs look nothing alike.

There were events tied to issuing of new equity. Some was to pay back debt, much like how governments have printed currency to pay back loans. Other events were asset acquisition, such as the take over of Glamis.

The midas touch, $6 billion of fiat book value in a single deal

Glamis was a gold producing company with a good development property. Their book value in their Q3 financial report before the takeover was $2.2 billion dollars. When Goldcorp took over Glamis the cash and equity value of what they issued was $8.2 billion dollars, and Goldcorp now carries $8.2 billion dollars in assets on their books for the Glamis properties.

Essentially, Goldcorp has a hyper-inflation of asset valuation being carried on their books. As assets are mined from the ground, an appropriate allocation of book value for each mine is written off.

The hyper-inflated Glamis assets are currently mostly non-producing assets, so what is currently written down is tiny compared to the total asset picture of Goldcorp, and it is tiny compared to the relative book value that the company is carrying for all of its properties. Once these assets start producing the writing down of the fair allocation of book value of these hyper-inflated assets will implode earnings.


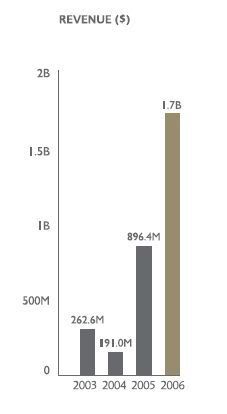
I find that Goldcorp is masterful at taking the focus from what ought to be the first priority for investors and and spinning impotent results into a good story. For example, look at the graph of revenue. It tells a stellar growth story, but merely looking back at the total share count suggests the revenue growth is inadequate compared to the equity growth.

Photo Sharing and Video Hosting at Photobucket


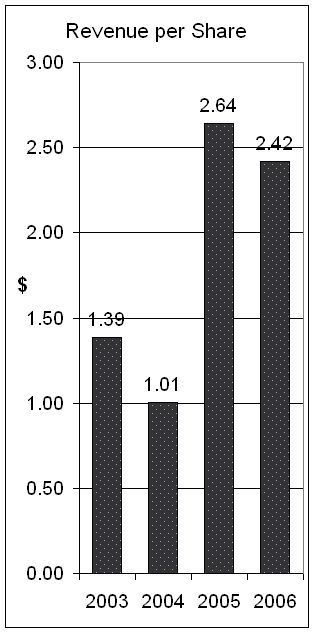
Indeed, the revenue per share has actually declined.


Photo Sharing and Video Hosting at Photobucket

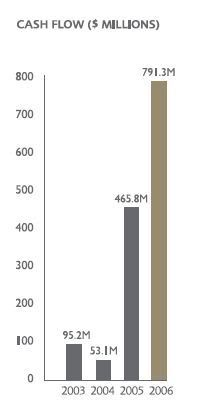
Goldcorp also printed a pretty cash flow chart, again in total cash flow, and again, a pretty picture.

Photo Sharing and Video Hosting at Photobucket


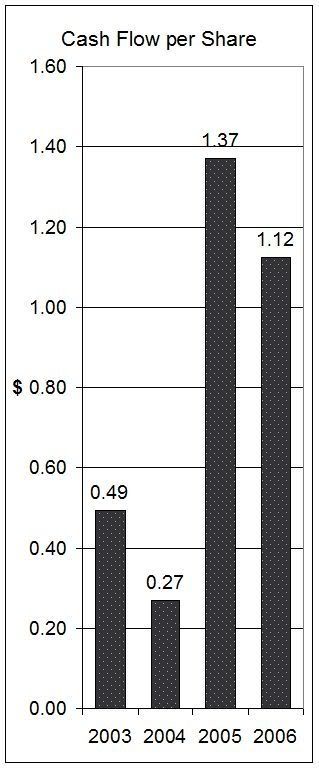
But again, the per share picture isn't so pretty, it is actually down 22%.

Photo Sharing and Video Hosting at Photobucket


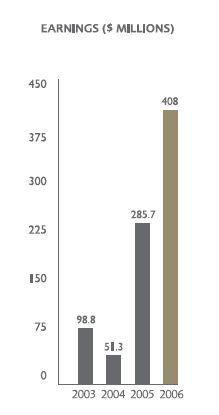
But not to be disuaded, I decided to look at the next "Go Goldcorp!" graph, which was earnings, and again, their presentation looks stellar.


Photo Sharing and Video Hosting at Photobucket


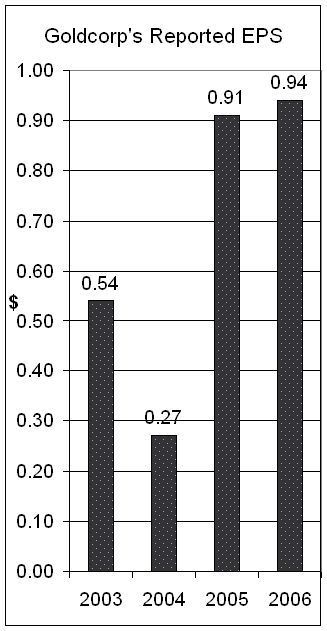
When you use Goldcorp's numbers for individual shareholders, it actually does look like an improvement.


Photo Sharing and Video Hosting at Photobucket


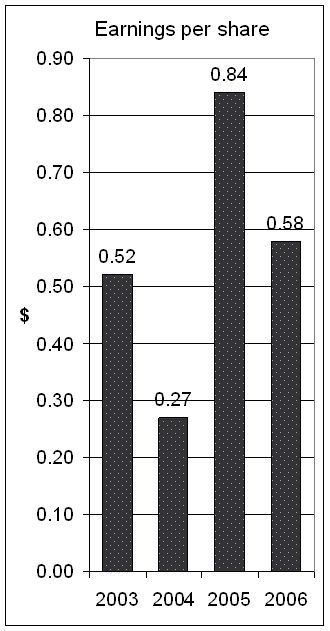
But I check calculations for myself I found $408 million in earnings when there were 703.5 million shares fully diluted did not "add" up to what they report. Practically none of the effects of share dilution and fiat book value from the Glamis merger show up in the financial reports. I took the earnings and the fully diluted share count at year end and re-plotted the data. This is ultimately what share holders are getting.

Photo Sharing and Video Hosting at Photobucket

In 2003 with 52c eps Goldcorp was trading under $16.

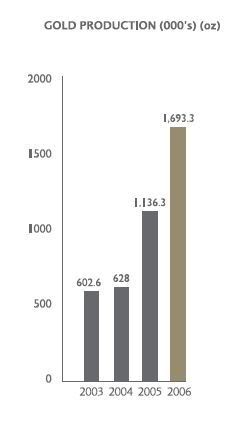
Goldcorp also puts its spin on gold production based on ounces for the company as a whole.

Photo Sharing and Video Hosting at Photobucket


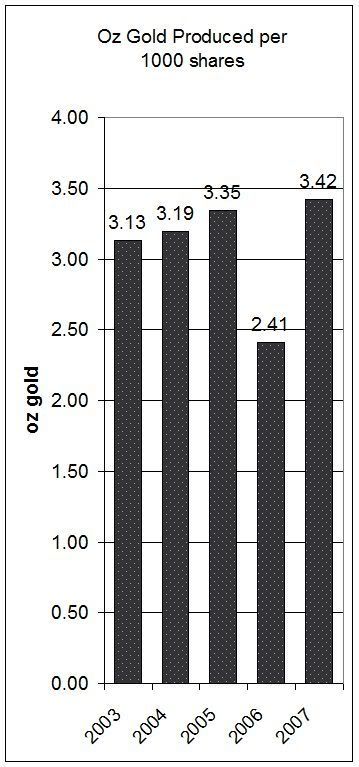
But, what Goldcorp is producing per share is far more important. The graph below is actually per 1000 shares, and the 2007 point is projected production. Already for 2007 production has been down graded twice from 2.8 million ounces.

Photo Sharing and Video Hosting at Photobucket

The 2006 figure has totally imploded. With about $24,000 US investment you can expect to see about 2.4 ounces of gold produced. It begs the question, how can anyone possibly think that this is reasonable? If they meet their targets for 2007, the gold production per share will return to the historical levels.

Even looking at Goldcorp's Q1 financial reports you can see how they steer investors from looking at what is important in terms of their individual share ownership and direct them to the big picture of a company that is under performing on a per share basis relative to prior years. Eps for Q1 this year compared to Q1 last year were way down, but they report stellar improvement.

All in all, Goldcorp belongs to the honor role for the frivolous cap of fiat creation.

Read More......

Friday, January 05, 2007

How I Discovered the Gold Bubble

I have been investing in the stock market and one of my investment "finds" started to have a sell-off when I thought it was undervalued. I needed to be sure that I had properly assessed my stock of interest, so I started on a journey of comparing two stocks for market valuation.

The stock that interested me is Northern Orion. The stock that I decided to compare it to was Goldcorp. I chose Goldcorp because Northern Orion owns 1/8th of the Alumbrera mine and Goldcorp owns 3/8th. It seemed that they should have similar valuation based on this one interest.

What I discovered was that Northern Orion was trading for about 10c on the dollar compared to Goldcorp. I still strongly believe that Northern Orion is undervalued, I never expected to find a gold bubble in mature gold stocks, one that in my mind is as serious as the tech bubble.

Read my analysis and decide for yourself. Aside from the copper concern, the majority of these concerns apply to mature gold stocks and will make them under perform beyond anyone's expectations.

The over valuation of Goldcorp


Goldcorp is a company with 702 million shares that took over Glamis in late 2006. Currently a check on any stock website is still not showing the 280 million extra shares from that takeover and is enormously understating market cap. At a share price of about $28.50, Goldcorp has a market Cap of $20 billion.

To understand why Goldcorp is overvalued, these things need to be examined and evaluated:

  1. The leverage of earnings of both copper and gold.
  2. The price elasticity of gold bullion to gold stocks, ie, market cap.
  3. The increasing cost of acquisitions.
  4. The roll of the life of a mine - increasing rates of depletion.
  5. The roll of lower quality gold properties.
  6. The roll of depreciating mines.
  7. The level of reserves to market cap.
Major Concern #1 - negative leverage of copper

When I looked at Goldcorp, it was prior to the Glamis merger. At that time I found from reading the financials that in Q2/06 64% of earnings came from one mine for Goldcorp, the Alumbrera mine, and for the first 9 months of 2006 60% of earnings came from Alumbrera. Alumbrera is copper, not gold. I'm not entirely sure for Goldcorp, but for Northern Orion in Q2/06 they got $4.44/lb average. When 60% of earning come from one mine, where the price of the commodity is going down, that is huge in terms of loss of income for the business.

Before the merger, there were 60% of the number of shares that there are now. This means that for the year, it can be expected that about 1/3rd of earnings for the entire company will have come from copper.

If you look at the average price of $1.01 prior to the bull on copper, copper increased to roughly 440% of its previous price. I truly believe this leverage effect of earnings on Goldcorp has been grossly under appreciated in terms of how Goldcorp can never again have the stellar performance of the past.

Alumbrera has a twofold effect on earnings for Goldcorp. First, for 2005, the earnings were not subject to the 20% royalty, so earn estimates for Goldcorp for Alumbrera for 2005 based on those copper prices will be less. The upside is that 2006 only saw gross earnings without that royalty payment for Q1, so 2006 earnings are not completely plumped up by an unrealized 20% decline in copper prices due to the royalty kicking in.

The second effect is that copper prices are going down and copper LME stocks are going up. Traditionally demand for copper is lower this time of year, so even though copper stocks are going up, that may turn around this quarter, but copper stocks are increasing rapidly. The other thing about copper, every producer that can has increased their existing output as best they can. This has in the shorter term increased supply, but in the longer term shortens mine life.

I have not done the required homework, so I really don't know how much of the new production is new mines, and how much is increased output of existing mines. But, my overall sense from my reading is that producers have gone for the fastest path to increasing production, which was to eliminate inefficiencies in current operations, Alumbrera is not exception, production has been increase by 10%.

The other thing that may have happened as well is that mines have not kept up on maintenance the requires reduction in output. As copper prices decline, those scheduled maintenance needs will happen, so in some respects, In the short term there may be an unsustainable increase in production. If I'm wrong, copper prices will decline further this year and will probably settle in the $2.25 range. I do not see copper averaging at $3.40 as predicted in the BMO analyst report, but possibly in the $3 range, but the recent decline in copper price and increases in stock make that an unlikely prospect.

The effect of the decline in copper prices is enormous for Goldcorp, as such a high percentage of its earnings were from copper. With 168 million pounds of copper, every dollar decline in copper requires gold to go up $54 at current production rates just to offset it. So, from the high of $4.44 to today's low of $2.51, based on a production of 2.8 million ounces, gold has to go up $92/oz for Goldcorp's earning to remain constant. I have taken into consideration that 20% royalty in this calculation.

Major, Major, Major Concern #2 - reduced leverage of Gold.

This concern is more a concept than actual numbers, but this concept will play out in earnings. It mathematically has to. I believe that the concept of leverage of earnings is being utterly ignored in analysts and brokers alike, and not recognized in terms of its ability to never again give repeatable results regardless of what the price of gold does now.

The simplest and most dramatic way to demonstrate this concern is to do a mathematical analysis using ratios. I teach ratios to kids in grade 8.

Say you have a producer who when gold was $300/oz managed to make $10/oz profits and the earnings/share worked out to 4%. Say the share costs $1. Now say gold is $600/oz. So now profit is $310 and a simple ratio gives earnings (310/10)x4 = 124%. This kind of leverage of earnings made gold such a stellar performer up to now in the market, but mathematically, it can never be repeated. The leverage ratio here is 31, utterly enormous. Share price would then adjust, go up 31 times, to $31 and the return would again be 4%.

What has happened is share prices have adjusted to market cap and shares have gone way up, so earnings are again 4%. Market cap has also gone up 31 times. If it was 1 billion, now it is 31 billion. Keep everything else constant, costs are still $290 for the sake of this analysis of the reduced effects of leverage.

So, now say gold goes up another $300, to $900. Now profit is $610. The leverage effect is now (610/310)x4 = 7.9%. The leverage effect now is 1.97. The reduced leverage effect of increasing prices is 31/1.97 is 15.8. This is a decimal number. I also teach percents to kids in grade 8. This is a reduction of leverage of 1580%, providing costs remain constant.

Leverage of earnings early in the bull run played a dramatic effect on the increase in earnings on gold shares from increases in gold prices in a way that I believe is *unrecognized and unrepeatable*.

This incredible leverage of earning early in the bull run, in my assessment, is probably responsible for erroneously justifying P/E of 25 to 50 are acceptable for gold stocks because profit grow rapidly with increasing gold prices. The stellar leverage is a one time only deal. It declines further with every dollar increase in the price of gold.

Major Concern - Price Elasticity of Bullion versus Market Cap Concern


This is a simple mathematical analysis that I've talked about with high school students in the classroom in terms of what I see happening with gold stocks in general.

Take gold at say a price of $625/oz. Say you buy an ounce and the gold price goes up to $725, or by $100. Your investment has increased by 16% and you own the gold bullion.

For simplicity, say the market cap of Goldcorp is $20 billion (it was very close to that). Their production forecast is 2.8 million ounces of gold, which at @ a $100 increase in the price of gold would bring in an additional $280 million. So, the absolute value of how much earnings could go up relative to market cap is 280/20000*100% = 1.4%. So, if earnings were 4% they could go up to 5.4% if gold went up $100, but taxes also have to be paid.

The price elasticity of the raw numbers of what you actually have is the bullion is 11 time better to own right now than the gold stock, if you believe that gold is going to go up in value.

What is really remarkable here, is that not only is the level of earnings pathetic with the stock in comparison to bullion, you not longer own the gold, or essentially you have a very negative return. The gold has been sold.

Major concern - Increasing cost of Acquisitions

The cost of replacement properties has increased dramatically. I've pasted a recent report at the end. At the beginning of the bull run reserves cost about $33 oz. The Glamis take-over cost $175/oz. This is around $140/oz increase in acquisition costs.

The exact numbers don't matter, for simplicity, there is about $140/oz increase in gold replacement costs. Previous analysis was just looking at all things constant. All things aren't constant, and in fact work against profitability. Costs are increasing. Gold needs to go up to about $750/oz just to maintain earnings in terms of what those replacement cost are.

For Goldcorp, $140/oz in increased costs translated to 2% less to earnings per share.

Major concern - The life of a mine - increasing rates of depletion

Some of the spins I've read on the life of mine gives that a short mine life is a good thing because mines stop producing and it gives constant demand.

My spin on it is very different.

Red deer, a Goldcorp's second largest contibutor to earnings, has a mine life left of 12 years. Alumbrera has a mine life left of 10 years. Prior to the merger, those two mines were making 80% of Goldcorp's earnings. There are 23 properties listed. It means that one, and sometimes two mines need to be built every year just to keep up, never mind growth. Replacement is enormous...

In the shorter term for Goldcorp you see production going from 2.8 million ounces to 3.5 million ounces. From that point on you see a rapid decline in output due to the end of the life of the mines, with 60% of the 3.5 million ounces in mines that come to the end of their life within 12 years.

The rate of depletion of Goldcorp gold reserves without replacement looks something like this:
2005 - 40.5 million ounces
2006 - 38.5 million ounces, 2 million mined, depletion, 5%
2007 - 35.7 million ounces, 2.8 million mined, depletion, 7.3%
2008 - 32.6 million ounces, 3.1 million mined, depletion 8.6%
2009 - 29.3 million ounces, 3.3 million mined, depletion 10.1%
2010 - 25.9 million ounces, 3.4 million mined, depletion 11.6%
2011 - 22.4 million ounces, 3.5 million mined, depletion 13.5%
2012 - 18.9 million ounces, 3.5 million mined, depletion 15.6%

This means that Goldcorp is in a squeeze position of having to constantly be acquiring new properties to keep this monster machine going. It puts Goldcorp at major risk for increasing costs, and indeed, the costs never stop because of the constant need for recapitalization.

Major concern - depreciating mines

Mines are depreciating assets. The average life of a gold mine is 14 years.

To my way of thinking in terms of valuation, that means that earnings need to be 7% to make up for the average depletion rate plus inflation plus whatever it is you expect for the risk you take. Strictly my opinion here, but without strong other mathematical reasons and evaluation, a P/E of 10 is the minimum as to where you start, and then make adjustments up or down based on the fundamentals of the gold stocks. How much is being added to reserves and how much is being mined. If new reserves are being added at the same rate as the depletion, a P/E of 12-15 may be justified.

Another way of looking at it for Goldcorp based on the 41 million ounces of reserves and 3.5 million ounces of production fore casted in the future, well, that means that in 41/3.5 = 12, so in 12 years all you own is empty holes, with the gold all mined and sold.

12 years of earnings at 3%, if Goldcorp can even manage that, gives earning returned over the life its reserves that is only 36% of market cap. With a P/E of 12 you'd get 100% of market cap returned, with no time cost of the investment. With an estimate of 2006 earnings at $1.03, a P/E of 12 would give a share price of $12.38.

Goldcorp has a higher rate of depletion than average, so imho, even a P/E of 8 for it is generous.

Major concern - Lower quality properties available for replacement.
Again, from the source below, there has been a drastic reduction in property finds with more than 2.5 million ounces. With production rates fore casted to be going up to 3.5 million ounces, there needs to be 1-2 of these properties per year found and purchased just as a replacement activity. The low supply should further increase costs of acquiring these properties.

Lower quality properties generally means higher mining costs.

Major concern - value of reserves to market cap

Goldcorp's web site reports for 2005 the following reserves:

40.5 million oz gold @$425 = $17 billion
687 million oz silver @$10 = $6.9 billion
1.5 billion lb copper @$1.35 = $2 billion
3.7 billion lb lead @$0.50 = $1.9 billion
8 billion lb zinc @$1.25 = $10 billion
Total: $38 billion

It isn't corrected for the 2 million ounces of gold production for 2006, but that can slide...

And there are properties that haven't been properly assessed. There may be 10 million ounces in those properties, or there may be 100 million ounces. The properties have not be assessed.

However, what they can show gives a mere 2.2 times the market cap (using $17 billion market cap).

It seems prudent that market cap to what they can show at bearish prices should be at least 5 times the known reserves. This valuation alone puts Goldcorp's share price at $10.80.

Summary of concerns about Goldcorp
  • Negative leverage of copper - gold must go up $90 to cover.
  • Declining leverage of gold - leveraged increases in earning can never match early performance -- it is mathematically impossible.
  • Price elasticity of the bullion is 11x that of the stock.
  • Increasing cost of acquisitions means that gold must go up $140 just to cover.
  • Depreciation of mines is higher in the gold industry than any other mining industry.
  • Quality of replacement properties is declining, meaning costs will increase.
  • Availability of replacement properties is declining meaning acquisition costs can further be expected to increase.
  • The ratio of reserves to market cap for Goldcorp is disgraceful.

At the end of my analysis of Goldcorp I was truly horrified that anyone would be recommending this stock. Certainly if any of my analysis has merit, many reputations will be seriously hurt. But personally, I wouldn't buy Goldcorp at $10. I simply don't see growth potential at that price.

My Conclusions:
  • Gold prices must increase $230/oz to maintain earnings for Goldcorp.
  • Assets are depleting at a much higher rate than earnings.
  • Goldcorp is trading at about 3 times its value.
  • All Gold companies are facing increasing costs, reduced leverage, and greater difficulty for finding replacement properties.
(stocks with higher costs to at the start of the bull run have not increased to the degree that low cost producers increased, they simply never had the same leverage of earning to pump up their stock prices.)

The Under Valuation of Northern Orion

I stated that I saw Northern Orion has being grossly undervalue. All of its earning come from copper, so it too should expect much lower earning from its existing operations. My interest in Northern Orion came not from it current earnings, but it massive reserves and massive growth prospects, comparable to the potential of Goldcorp 6-7 years ago. Northern Orion has massive increase in earning opportunity even in a declining-copper price market.

Points that favor Northern Orion
  1. Market cap to reserves is enormous.
  2. Strong cash position.
  3. Expected cash from warrants can provide some capital costs.
  4. Good cash flow from Alumbrera.
  5. Aqua Rica property is well studied and Northern Orion has applied for building permits.
  6. Production increase is forecast to increase by 660% when the new mine starts.
  7. Low cost producer because of net credits of gold and molybdenum.
  8. Lower depletion rates.
Reserves to Market Cap for Northern Orion

Northern Orion has two properties, its 1/8th interest in the Alumbrera mine and Agua Rica.

The Alumbrera mine has 10 years of life left, Northern Orion's share is 50 million pounds per year of copper and 75,000 ounces of gold, exactly 1/3 of what Goldcorp gets from this mine.

Simple extrapolation, total reserve of this property is 1/2 billion pounds of copper and 750,000 ounces of gold, which at $1.35 for copper and $400 for gold is $0.675 billion for copper and $0.300 billion for gold, or about $1 billion.

The Agua Rica property is Northern Orion's hidden gem.

The feasibility study gives this total as to what can be mined over a 23 year period. This is more conservative than just looking at the reserve because recovery rates are taken into account. There are 6 million ounces of gold in the reserve, but only 3 million ounces are considered recoverable as about 50% of the reserve is not recoverable in the mining process. There are 13 million ounces in the resource. There are 21.4 billion pounds in the resource for copper and 1.7 billion pounds for molybdenum.

The recoverable metal estimates for Agua are
7.6 billion pounds of copper @1.35 = $10.3 billion
3 million ounces of gold @400 = $1.2 billion
360 million pounds of molybdenum. @12 = $4.3 billion

The two properties combine give $17 billion at $1.35 for copper, $12 for molybdenum and $400 for gold.

Diluted, Northern Orion has 221.5 million shares. At $3.70/share that gives a diluted market cap of $820 million ($560 million undiluted).

So, at bearish prices reserves to market is 21 times. A valuation of 1/10th production forecasts at bearish prices gives a valuation of $7.40.

Strong Cash Position and Warrants

Northern Orion has $180 million in cash in the bank. Should the fully diluted market cap be realized, it will have an extra $160 million from warrants. That's $340 million dollars, leaving only $400 million of market cap for valuation of the rest of the assets.

If you take the bearish value of what's in the ground, $17 billion and compare it to the rest of the market cap, well, that's 42 times the market cap less cash position.

Strong cash flow from Alumbrera

For 2005, with average copper prices at $2.37 equity earning were $46,755,000, and cash flow was $75,500,000. Earning per share at this price was $0.31. This is in the "ball park" of where copper prices can be expected and cash flow for the size of the company is strong.

Over the three years to bring the new mine to production, it is reasonable to expect another $150 million to retained earnings which can be used towards the construction costs of the new mine. Quarter 2/06 had cash flow of around $56 million alone. This drastically reduced estimate takes into account strong declines in copper prices, but is still strong cash flow.


Aqua Rica is ready for building.

The Aqua Rica property has an strong investment in drilling and feasibility studies and is at the point that permits have been applied for to build the new mine. The down side is that it is expected to take 8-10 months to get the permits approved.

Production growth is enormous compared to current operations.

The new production is expected to be:
  • 368 million pounds of copper
  • 120,000 oz gold
  • 15.4 million pounds of molybdenum.
The increase of cash flow at prices of $2 for copper, $425 for gold and $12 for molybdenum is $736 million for copper, $51 million for gold, and $185 million for molybdenum, for a total of $970 million dollars.

At a price of $2.37 for copper Alumbrera earned $0.31/share. A simple ratio extrapolation for a $2 price with a 660% increase in production gives (2/2.37) x (7.70) x 0.31 = 6.5 x 0.31 = $2/share earnings. This doesn't take into account there would also be molybdenum, which is like a bonus production. 185/221.5 = $0.84, so earnings should go to somewhere between $2-3/share.

The cash flow situation is that Northern Orion will have in the range of a half billion to pay for the new mine and will need to finance $1.5 billion. Their assets and cash flow are strong enough to do this without further dilution.

The new mine production is going to generate a cash flow in the range of what Alumbrera generates, only this will be 100% Northern Orion owned. To put this into perspective, Northern Orion's cash flow can be expected to be in the range of 40-50% of Goldcorp's 2007 cash flow, yet it has a market valuation 1/20th of that of Goldcorp. ($820m vs $17 billion) Further, the difference in the mine life (23 years) and availability of replacement reserves means that Northern Orion would not be subjected to they same types of increasing costs.

Low cost producer due to gold and molybdenum cash credits, lower depletion rates

Aqua Rica's cash costs for production would make it one of the lowest cost producers. This is the type of circumstance that led to the stellar growth and returns for Goldcorp, with a difference, depletion rates are lower. After the new mine is built, the shorter term, depletion rates are very high and cash flow is higher. Total production for 2012-2016 for copper would be 418 million pounds. It declines to 368 million pounds in 2017 when Alumbrera has come to the end of its life, and in 2022 the highest streams of copper are expected to be mined and production further declines to 300 million pounds for another 13 years.

The rate of depletion of Northern Orion's copper reserves looks something like this:
2006 - 8.1 billion pounds
2007 - 8.05 billion pounds, 50 million mined, depletion, 0.6%
2008 - 8 billion pounds, 50 million mined, depletion 0.6%
2009 - 7.95 billion pounds, 50 million mined, depletion 0.6%
2010 - 7.7 billion pounds, 250 million mined, depletion 3.1%
2011 - 7.28 billion pounds, 420 million mined, depletion 5.5%
2012 - 6.86 billion pounds, 420 million mined, depletion 5.8%

The cash flow is such that capital cost can be paid back while there is the higher production from the new mine as well as the continued cash flow from Alumbrera.

With longer mine life, Northern Orion is never in the type of squeeze position that mature gold stocks are in. Over the long term, they are not subjected to the same squeeze to keep production going to ensure maintenance of earnings, never mind to increase them.

Summary of under valuation of Northern Orion

  • The value of what's expected to be sold at half of today's market prices is $17 billion, 22 times the diluted market cap, and using a value of market cap being 10 times bearish price estimates give a today value for Northern Orion of $7.40.
  • Earnings per share can be expected to increase to about $2/share even if copper is $2/lb. With a target P/E of 10, once production is in full swing, target price can be $20/share. With a target P/E of 8, target price can be $16.00.
  • Northern Orion has a strong cash position, 35% of it undiluted market cap in cash, and 46% of its diluted market cap taking into account the cash from warrants.

My Conclusion: Northern Orion is grossly undervalued. It is a strong buy to $7 based of property holdings alone.

Everywhere I look, I think I've been conservative towards Northern Orion, and actually generous towards Goldcorp. For example, I've stated 10 times bearish prices for Northern Orion, using bearish prices, whereas for for Goldcorp I've suggested it should have 5 times the reserves at bearish prices relative to market cap. The estimate for Northern Orion puts copper at $1.35, highly, highly bearish. The estimate for Goldcorp uses reserve, for Northern Orion the estimate is corrected for the non-recoverable percentage in the mining process.

Copper prices have declined faster than expected, but there is a new mine entry barrier price. Northern Orion's entry price is much lower than average due to low production costs, and the enormous reserve was acquired at very low costs.

The recent Phelps Dodge merger puts an in the ground valuation for copper at $0.70. Their average production costs are $0.50/pound. With Northern's Orion's net of metal credits production costs at -$0.02, it is simply far more competitive.
Another tiny cap stock, Equinox, shows production costs of $0.70/lb.

Starting at a copper price of about $2.25 high cost producers start to have problems raising capital costs, and it increase from there. The sell off of Northern Orion indicates how true that is in terms of being able to attract capital for investment as copper prices decline. Copper was able to stay at around $1/lb for so long because land and capital costs had long been paid for, and the long life of mines enabled them to simply continue as ongoing concerns, without capital for replacement or new investment. And, at those prices, mines were going bankrupt.


Gold Takeovers Reach Record on Lack of New Supplies

By Choy Leng Yeong
Dec. 27 (Bloomberg) -- Gold-company acquisitions this year surged to the highest level in at least a decade, and the industry may continue its buying spree in 2007 as producers struggle to find new deposits.
Goldcorp Inc.'s $8.5 billion acquisition of Glamis Gold Ltd. was the biggest of 357 deals valued at a total of $24.3 billion this year, data compiled by Bloomberg shows. That eclipsed the $16.2 billion spent last year on 341 transactions, including Barrick Gold Corp.'s $10 billion purchase of Placer Dome Inc.
Producers are rushing to boost supply because mines are being depleted faster than new reserves are being found, and a six-year rally in gold prices is providing cash to buy assets. The number of discoveries of at least 2.5 million ounces has declined for eight straight years, according to Metals Economics Group in Halifax, Nova Scotia.
``The driving force behind the M&A is that you have difficulty finding new gold mines,'' said Graham Birch, who helps manage $27 billion at BlackRock Investment Management in London. ``It's all about trying to get access to reserves.''
From 1992 to 2005, the world produced 1.1 billion ounces of gold, or 1.8 times more than the new resources discovered among deposits of at least 2.5 million ounces, Metals Economics Group said.
The drop in new reserves followed years of reduced spending on exploration as gold fell to a 20-year low of $253.20 an ounce in 1999. Worldwide exploration budgets fell to a 12-year low of about $780 million in 2002, said Jason Goulden, director of corporate exploration strategy at Metals Economics.
`Scramble for Land'
``There is a scramble for land,'' said Ian Cockerill, chief executive officer of Johannesburg-based Gold Fields Ltd. ``From about 1996 until about a couple of years ago, there was a marked decline in the amount of exploration dollars. The industry is staring down the barrel of the gun that says, `Where are the replacement ounces coming from?'''
Gold Fields, the fourth-largest producer, earlier this month completed a $1.53 billion purchase from Barrick of half of the world's biggest deposit, the South Deep mine in South Africa. Gold Fields is buying shares in Western Areas Ltd., which owns the rest of South Deep. The deal will increase the company's reserves by about half.
The price of gold has more than doubled to $630.30 an ounce today from a 20-year low in 1999. The precious metal reached a 26- year high of $732 on May 12. The rally, fueled by investors seeking a hedge against inflation or an alternative to the dollar as it fell against the euro, has spurred demand for new reserves.
Cost of Reserves
The cost of reserves rose to a record $120 an ounce in 2005, compared with a low of $33 in 2000, said James Lowrey, a senior analyst at Metals Economics, which tracks more than 1,450 companies and deals of at least $50 million since 1995.
Gold Fields CEO Cockerill admits he paid top dollar for the South Deep mine at $104 an ounce. ``It is certainly one of the more expensive acquisitions that we have made'' compared with the company's historical average of $60, he said. ``But then again, it's a very special ore body.''
The mine, west of Johannesburg, contains as much as 29.3 million ounces, equal to about a third of the world's annual gold production. Gold Fields plans to study the viability of expanding annual production to 1 million ounces, from the 800,000 ounces expected yearly by 2011.
Vancouver-based Goldcorp spent about $175 for each ounce of reserves it acquired in the Glamis deal last month, and Toronto- based Iamgold Corp.'s $1.1 billion stock acquisition of Cambior Inc. valued each ounce at about $117, Lowrey of Metals Economics estimated.
Doing Deals
Doubling resources is a ``big rationale for doing this deal,'' said Goldcorp Chairman Ian Telfer, who has made more than eight acquisitions in the past four years. The purchase of Glamis helped Goldcorp overtake Johannesburg-based AngloGold Ashanti Ltd. as the world's third-largest gold producer by market value.
Citigroup Inc. was the top investment bank with five deals worth $11.6 billion, accounting for 48 percent of the market share. It advised Glamis on its takeover by Goldcorp. JP Morgan ranked second with $11.4 billion and seven deals, including Glamis.
Global gold production in the nine months ended September fell 2.2 percent to 1,804 metric tons from a year earlier, London- based researcher GFMS Ltd. estimated. The lack of new supply will help boost gold prices by $200 over the next two years, topping $800 an ounce, Telfer said.
``There is definitely a sense that the industry -- which is really good for gold -- is kind of flat to shrinking,'' said Barrick Chief Executive Officer Gregory Wilkins. ``Placer was important for positioning the company for dealing with the industry challenges.''
Gold-Company Shares
Shares of Toronto-based Barrick, which completed its acquisition of Placer Dome in March, rose 6 percent this year. Denver-based Newmont Mining Corp., whose bullion sales may plunge 14 percent this year, has fallen 15 percent, the biggest drop among the 16 companies in the Philadelphia Stock Exchange Gold and Silver Index.
Newmont, which spent $225 million to boost its stake in a mining project in western Australia this year, cut its 2006 sales forecast three times, most recently in September, because of lower output in Ghana and Uzbekistan. The company said Sept. 27 that its gold sales may fall 14 percent this year to 5.6 million ounces from 6.5 million in 2005.
Freeport-McMoRan Copper & Gold Inc., owner of the world's biggest gold mine, last month agreed to buy copper producer Phelps Dodge Corp. for $25.4 billion. Kinross Gold Corp., Canada's third- biggest gold producer, agreed to purchase rival Bema Gold Corp. for $2.84 billion in stock to expand in Russia.
Barrick's Wilkins said his acquisition strategy won't be affected by short-term changes in prices, which have fallen 14 percent from the 26-year high reached in May.
More Bids
Barrick may make a bid for New Orleans-based Freeport to boost reserves and lower operating costs, CIBC World Markets Inc. said in a research note on Dec. 15. Both companies have declined to comment. Barrick on Dec. 7 failed in its $1.71 billion hostile bid for Vancouver-based NovaGold Resources Inc.
Kinross Chief Executive Officer Tye Burt said takeovers may get a boost from the recent slump in prices.
The decline may bring ``more targets into a price zone'' to encourage acquirers, Burt said. ``In a strong commodity price environment, it's always tough to reach price agreements. Everyone's trying to protect their production profiles.''

Read More......