I wrote most of this a couple months ago, but I've done some edits to update.
"Pricing-to-market" long term debt or credit is really quite a shocking concept, as the numbers will show, yet this appears to be a common practice.
I had a look quick look at the numbers for this and it got me thinking about some bonds my financial adviser had me in. When I bought rate of return to maturity was around 6% and when I sold it was around 4.5%. It had about 10 years to maturity when I bought it and 6 years left when I sold it. This was actually one of the better investments from my adviser because of the leverage of the interest rate and the bond pricing itself down to a lower rate of return. To make the example simple, say in 2012 it pays $10,000 at maturity. The easiest way to calculate the buy price at each year is to just divide by 1 plus the rate, as I have done for the table at both 6% and 4.5%.
| Year | 6% PV
| 4.5% PV
|
| 2002 | 5,584 | 6,438
|
| 2003 | 5,919 | 6,729 |
| 2004 | 6,274 | 7,032 |
| 2005 | 6,651 | 7,348 |
| 2006 | 7,050 | 7,679 |
| 2007 | 7,473 | 8,025 |
| 2008 | 7,921 | 8,386
|
| 2009 | 8,396 | 8,763 |
| 2010 | 8,900 | 9,157 |
| 2011 | 9,434 | 9,569 |
| 2012 | 10,000 | 10,000 |
So, in 2002 with it paying 6% I’d have been able to buy the bond at $5,584 and in 2006 with it priced to 4.5% I’d have been able to sell it for $7,679. My return for the 4 years would have been about 37.5% or 8.3% annualized. My rate of return ended up being 38% higher than I expected (8.3/6 – 1), and for me, that was a leveraged advantage of that bond due to the number of years left on it and how the market priced itself down to lower rates of return.
In the declining interest rate market since the early 1980s buying longer term debt at a higher rate and selling later when rates decline would increase the return due to this kind of "pricing-to-market."
It got me thinking, just how much leverage of debt has the banking system added with not only low interest rates, but also the packaging of mortgages and selling them as bonds? The M2 money supply has been increasing dramatically relative to the M1 money supply. To what degree can the activity of banks explain this?
First, a graph of M1 and M2 money supply:
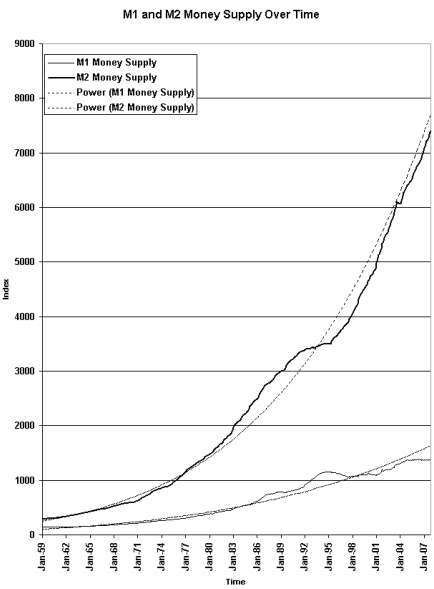
I am not sure about all of the calculations of the M1 money supply, but the Federal Reserve's printing press increases the money supply and then the banks have always taken that money supply and when they loan it out, it is leveraged. Traditionally the leverage was 12.5 to 1. Apparently the leverage is now about 30 to 1 and that has implications of nightmares. The “OMG, what have they done? How could they be so irresponsible and negligent?” questions are so long overdue, I personally don’t see how anyone can escape this nightmare without some serious hurting here.
Seriously, if knowing that the leverage has increased this much hasn’t raise enormous concerns in you, you are probably in big, big trouble with your investments.
I also did a graph of the ratio of M2 to M1:
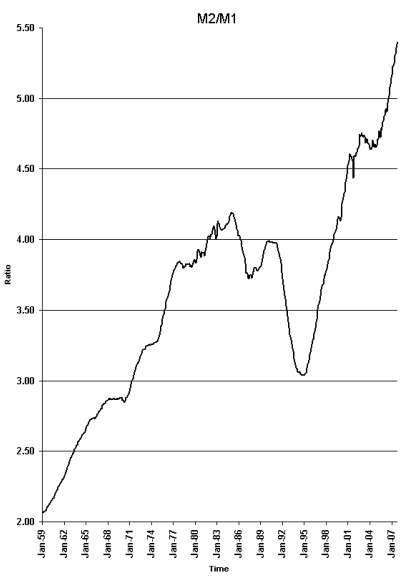
Responsible monetary policy would show this graph as a horizontal line, not something heading into the stratosphere. Where the ratio was close to 2 fifty years ago it is now 5.4. Think of this as increased risk, because that is the implications of it. That’s 270% of increased risk. Think of those mortgage bonds causing the liquidity problems as part of that risk.
So, do I know where all this leverage is coming from? No, but the leverage from my little 10-year example is but one small example. I don’t think that example is particularly serious for the economy. The type of company was very stable and although uncertainty increases with increased time, a 10-year window isn’t too bad.
But, they’ve packaged these bonds with 30-year mortgages based on people’s personal lives. That is so much different than 10-years with ongoing businesses like utility companies.
First, how different are families from utilities?
There is an implied trust that payment streams will continue from families until the debt is repaid. What’s the relative difference in risk? I did a blog, “Bad Feeling Good Times,” which was inspired by how the employment world, and standard of living has been changing. Workers born between 1957 and 1964 have held an average of 10.5 jobs and I think that is probably getting worse, not better. Add in that mortgages are based on family incomes and families sometimes fail. A utility company isn’t going to get a divorce, cancer or have an unexpected pregnancy.
And homes have been priced to family income based on low interest rates. This is another form of leverage. Traditionally mortgages were granted so that only 30% of your gross income could be used for the mortgage payments and property taxes. It seems to me that when I worked in banking mortgages were over 25 years, not 30, but I will use 30 years because this is what is being sold. Heaven forbid, a blog I read somewhere this week was talking about mortgages that had been granted allowing 50% of income for debt servicing. Seriously, this is economic slavery. There is no hope ever of digging out of that level of debt.
So, in how many ways is mortgage leverage playing out in the economy that it can collapse?
Take a household income of $100k lets have a look at how much mortgage they qualify for at different interest rates and difference percentages of income. To simplify this calculation I assume only mortgage payment, and no property taxes for this 30-year table.
Rate / % income
| 30% | 35% | 40% | 45% | 50% |
| 2% | 676,000 | 789,000 | 902,000 | 1,015,000 | 1,127,000 |
| 3% | 592,000 | 691,000 | 790,000 | 889,000 | 988,000 |
| 4% | 524,000 | 611,000 | 698,000 | 785,000 | 873,000 |
| 5% | 465,000 | 543,000 | 621,000 | 699,000 | 776,000 |
| 6% | 416,000 | 486,000 | 556,000 | 625,000 | 695,000 |
| 7% | 375,000 | 438,000 | 501,000 | 564,000 | 626,000 |
| 8% | 340,000 | 397,000 | 454,000 | 511,000 | 568,000 |
| 9% | 310,000 | 362,000 | 414,000 | 466,000 | 518,000 |
| 10% | 285,000 | 332,000 | 380,000 | 427,000 | 475,000 |
| 11% | 262,000 | 306,000 | 350,000 | 394,000 | 438,000 |
| 12% | 243,000 | 284,000 | 324,000 | 365,000 | 405,000 |
First, the fact that this is a 30-year table means that it already has debt amortized over an excessive amount of time. It means that it is already not conservative in any way, shape or form. Because it has become a social norm does not mean it has prudence built into it.
In the Great Depression the fed was able to do something because 15 year mortgages could be extended to 30 years. Borrowing at 8% interest over 15 years would allow the 100k family to borrow $262k versus the $340k they can borrow over 30 years. If you then need to increase the payment to be over 30 years, you can reduce payments by 23%, $578. You only reduce payments by . Changing that 30 year mortgage to 40 years and you reduce payments by a piddly 6%, $140. Read the numbers, no amount of refinancing can fix this.
Set the qualifying standards to 30% of income at 12% as the maximum for a prime loan over 30 years and now you have prudence built into lending. It is insane and grossly ignorant to have allowed mortgage amounts to have increased to an identical percentage of income as rates declined. It is applying a linear standard to a concept with exponential properties. It is an exponential addition of risk.
And then a larger degree of insanity was added when the allowable percent of income was increased. And this has been referred to as progress and even a good thing by calling it “modernization” of loans?
It isn’t a good thing, a wise thing, or modern innovation; it is an innovation of mass economic destruction that lines the pockets of a few for a relatively short period at the economic peril of the masses for a long term and has enormous spill over costs that are already being felt around the world, for example, Yukon has $36 million of this mortgage debt frozen, a bunch of Norway small towns have lost half this year's budget, including the school budgets, etc.
The degree of leverage, or money creation as that table goes from prudent at 12% and 30% of income to Master of Snake Oil finances at 2% and 50% of income is 464%. To see the same income qualify from a low of $243k to a high of $1.1 million is an absurd range with an absurd level of increased risk.
Add to that risk how second mortgage terms have changed, which have again increased leverage and risk.
When I look back to the 70s and my mother’s second mortgage, well, paying the debt back was a shorter term – a 10-year time frame. And what have the Snake Oil Financial Wizards of the 21st century done? They’ve issued second mortgages that span 30 years and have the first five years as interest only payments! Lending standards of the 70s allowed up to an additional 8% of income to be going towards this shorter-term debt, which included car loans and student loans. For this example we'll assume no student loans or other debt. The table shows how much second mortgage a $100k income could support with a 10-year repayment plan and the insane 30-year repayment plan with 8% of income for a household with $100k of family income.
| Rate | 10 Year Mort
| 30 Year Mort
|
| 2% | 72,000 | 180,000 |
| 3% | 69,000 | 158,000 |
| 4% | 66,000 | 140,000 |
| 5% | 63,000 | 124,000 |
| 6% | 60,000 | 111,000 |
| 7% | 57,000 | 100,000 |
| 8% | 55,000 | 91,000 |
| 9% | 52,000 | 83,000 |
| 10% | 50,000 | 76,000 |
| 11% | 48,000 | 70,000 |
| 12% | 47,000 | 65,000 |
It is interesting to note the total level of mortgage debt a $100k household income could carry with prudent lending standards -- 30% of income @12% -- in comparison to what is considered an affordable home. You have a $243k first mortgage and at the same12% an additional $47k, for a total of $290k. Affordable housing is defined as being 3 or less for median home price over median income. If you look what prudent lending standards of the past allowed, well, they would only allowed you to buy a home you could afford! And make no mistake here; household budgets are tight when paying for homes at three times household income.
By increasing the length of repayment on the second mortgage the borrower ends up with $160k more in debt servicing costs, $8k x 10 years = $80k versus $8k x 30 years = $240k. It is a disaster in terms of people’s ability to get ahead of the debt. With 30-year second mortgages there is no 10-years of hardship and then life gets easier. They won’t be freeing up cash flow for when their car needs replacing with their 30-year second mortgage and forget about saving for retirement or their children’s education.
If you want true economic strength from low interest rates you set a prudent standard and then if rates are lower, well the family spends a smaller percent of their income on debt servicing. The family then has options to save for retirement, pay down debt faster, and to spend money in the economy on other goods and services. The economy isn't then crippled, or in this case, slaughtered, if it slows.
Lower Interest Rates Do Not Stimulate the Economy.
The analysis or suggestion that lower interest rates stimulated the economy is grossly incompetent and a very shallow, short term view.
In the shorter term, if you consider the masses that were already homeowners, well, they were able to reduce debt-servicing costs by refinancing and they were indeed able to stimulate the economy by spending that money elsewhere. However, because of the insane lending standards, as rates declined, housing prices were bid up to what families could afford with 30% of their income at the lower rates, as in the table. They were also bid up by increase the amount of income qualifying. Over time, the ratio of those who can benefit from lower rates declines. Further, the ratio of savings from reduced rates declines. Those who are trapped with a different kind of debt and little hope of relief increases. Low interest debt is a very different animal, than high interest debt, as analysis further down shows.
Low Interest Rates: The Dr. Jekyll and Mr. Hyde of Debt Management.
Rate / % income
| 30% | 35% | 40% | 45% | 50% |
| 2% | 676,000 | 789,000 | 902,000 | 1,015,000 | 1,127,000 |
| 3% | 592,000 | 691,000 | 790,000 | 889,000 | 988,000 |
| 4% | 524,000 | 611,000 | 698,000 | 785,000 | 873,000 |
| 5% | 465,000 | 543,000 | 621,000 | 699,000 | 776,000 |
| 6% | 416,000 | 486,000 | 556,000 | 625,000 | 695,000 |
| 7% | 375,000 | 438,000 | 501,000 | 564,000 | 626,000 |
| 8% | 340,000 | 397,000 | 454,000 | 511,000 | 568,000 |
| 9% | 310,000 | 362,000 | 414,000 | 466,000 | 518,000 |
| 10% | 285,000 | 332,000 | 380,000 | 427,000 | 475,000 |
| 11% | 262,000 | 306,000 | 350,000 | 394,000 | 438,000 |
| 12% | 243,000 | 284,000 | 324,000 | 365,000 | 405,000 |
Looking at the above chart again, consider a 5% decline in interest rate, from 12% to 7%. Originally the $100k of income qualified for $243k, but it increase to $375k. The second mortgage goes from $47k to $100k. The $290k has been bid up to $475k, but there isn't an extra $185k of value or cost inputs into that home.
It helps to explain how it is that builders have been getting compensation increases for their work that is out of line with the realities of the rest of us. At the management level way too many are getting paid a million a year for the same kind of skill set that others in other types of companies make perhaps $100-250k.
One of the many reasons the economy is only stimulated short term from rate cuts is that as time goes by you have more and more first-time homeowners that initially borrowed at lower rates and simply have higher debt to income ratios. These people are not benefiting from lower interest rates because their debt servicing costs have not been reduced, instead, they have sky rocketing principal repayment demands.
They are experiencing a reduced leverage ability to get ahead, which I outline below, and this is a huge reason for why low interest rates hurt more than they help. Newer homeowners started at the maximum debt servicing allowed at lower interest rates. You also end up with people who upgrade and also bid up their debt servicing costs so they are no longer a part of the benefiting population. In Canada, where you mortgage rate renews every 3-5 years there is also way more upside risk to interest rates than potential downside gains. Homebuilders who bought land cheap initially make a killing as home prices are bid up to a faulty qualifying criterion. As time goes by you also have more people refinanced into lower rates, so there is no longer any place for them to increase their disposable income.
This time lowering interest rates does little because people are already maxed out on debt financed at low rates. Fewer have the option of refinancing to reduce repayment burden.
There is enormous extra risk when people have been paralyzed in their ability to reduce their debt burden from housing being bid up to a fixed percent of income as rates have decline. Lending standards might as well have been designed by elementary school children for their lack of analysis and prudence to make adjustments to requirement based on the interest rate rather than the household income. I picked up banking math errors written into law when I was a teenager with only my high school math skills, so I am quite serious to question how bankers can justify that their maths skills exceed that of elementary grade student to have not adjusted lending standards to make sense relative to interest rates. We have yet to bear the brunt of the increased economic risk of what they have done.
Paying back the mortgage with 30% of $100k of income over 30 years means that everyone regardless of the purchase price will pay $900k between paying back principal and interest. For a 10-year second mortgage at 8% they will pay back $80k and at 30 years $240k. The table below shows the distribution of principal and interest at the various rates.
| Rate | Principal
| Interest | 10 Yr Prin
| 10 Yr Int
| 30 Yr Prin
| 30 Yr Int
|
| 2% | 676,000 | 224,000 | 72,000 | 8,000 | 180,000 | 60,000 |
| 3% | 592,000 | 308,000 | 69,000 | 11,000 | 158,000 | 82,000 |
| 4% | 524,000 | 376,000 | 66,000 | 14,000 | 140,000 | 100,000 |
| 5% | 465,000 | 435,000 | 63,000 | 17,000 | 124,000 | 116,000 |
| 6% | 416,000 | 484,000 | 60,000 | 20,000 | 111,000 | 129,000 |
| 7% | 375,000 | 525,000 | 57,000 | 23,000 | 100,000 | 140,000 |
| 8% | 340,000 | 560,000 | 55,000 | 25,000 | 91,000 | 149,000 |
| 9% | 310,000 | 590,000 | 52,000 | 28,000 | 83,000 | 157,000 |
| 10% | 285,000 | 615,000 | 50,000 | 30,000 | 76,000 | 164,000 |
| 11% | 262,000 | 638,000 | 48,000 | 32,000 | 70,000 | 170,000 |
| 12% | 243,000 | 657,000 | 47,000 | 33,000 | 65,000 | 175,000 |
What is important to consider, principal is expected to be paid back 100%. Interest, however, can be modified through increased payments.
First, by increasing the second mortgage from a 10-year term to a 30-year term total payments increase by $160k. So this one change makes the total payment stream change from $980k to $1,140k, or a 19% total increase.
Look at the 12% row. At 12% only 27% of the $900k paid over the 30 years is principal. The rest is interest. The greater the proportion of the repayment schedule being interest the better. Consumers usually have a clause that allows them to prepay a certain amount of the mortgage and that gives an enormous ability to reduce the repayment burden by reducing the amount of interest they pay.
The principal has to be repaid in full, however, because 73% of the repayment burden is interest, there is enormous opportunity to reduce the repayment burden by taking advantage of clauses allowing increased payments.
Rate
| no increase
| 10% increase
| savings
| 20% | savings |
| 12% | 360 months
| 216 months
| 306,000 | 167 months
| 399,000 |
| 7% | 360 months
| 272 months
| 152,000 | 224 months
| 228,000 |
| 2% | 360 months
| 316 months
| 31,000 | 282 months
| 54,000 |
Say the household increases their monthly payment from 30% of income to 33% of income. A mere 10% increase in mortgage payment changes the repayment of the mortgage from 360 months to 216 months. The total payment stream for the first mortgage changes from $900k to $594k, or total savings of $306k to the homeowner. A highly manageable payment change has reduced the debt burden by more than 1/3rd. An increase to 36% of household income reduces the term to 167 months and $501k, for a total savings of $399k. Notice that the second extra 3% of gross income did little compared to the first extra 3%. So, when homes were priced affordably at 12% interest there was an enormous ability to redistribute the household cash flow to reap enormous benefit, and when I worked in banking in the early 80s this was the behaviour I witnessed. Indeed, there is high motivation to reduce debt and I saw people regularly paying off their mortgages while still in their 30s.
Contrast the example to a home being bid up to 30% of household income at 7%, a rate that many home owners have today, the stuff of the so-called rate freezes in the media today. In this example 42% of the payment stream is principal. $375k is 54% higher than $243k and even though the payment is the same, the home owner’s leverage to get ahead has been grossly marginalized. Increasing payments by the same amount, to 33% of household income, reduces the number of months to 272 and the total payment stream to $748k, a savings of $152k, which is less than half of the savings the same increase in payment gave before. A 20% increase in payment, or going to 36% of gross income reduces payments to 224 months, or $672k or total savings of $228k. In order to save the same $306k in interest as the homeowner who qualified at 12%, the 7% qualifier would have to increase payments to 41.5% of their household income, a highly unlikely feat to manage.
Finally, consider the 2% debt. The benefit from increasing payments by 10% or 20% is almost negligible. Where's the hope of getting ahead? Additionally with a 2% teaser second mortgage over 30 years versus 10 years the extra principal the homeowner gets saddled with is $108k.
By changing the second mortgage standard from 10-years to 30-years very little money ends up going to principal. At 30 years for $100k at 7% about $73 of a $667 payment goes to principal compared to about $330 going to principal when the mortgage is restricted to 10 years and $57k. At the end of a year the prudent lending standard has the homeowner roughly $4k less indebted with the second mortgage. This is $4k of reduced risk for the mortgage holder. Further, there is no way homes would have been bid up to today's prices and affordable homes are more likely to retain their value than unaffordable homes.
So what you have here simply from interest rates declining and no adjustment of lending standards to account for the gross differences in the consumer’s ability to handle the debt over the long term is a leverage of money supply, the bank is able to loan $475k versus $290k with a decline in interest rate from 12% to 7%.
I saw 12% mortgages when I worked in the bank in the early 80s so it is a generational difference in the level of empowerment to manage debt. Anyone trying to say that higher interest rates were harder has the foulest smelling diarrhea of the mouth. There is huge empowerment to reduce the repayment burden. Further, they had the benefit of seeing rates drop and with it the ability to renegotiate lower rates. Having an already fixed debt and interest rates decline is what made lower interest rates easier for them, and empowered them to stimulate the economy. They are comparing a starfish to a giraffe and ought to be able to see the difference.
Furthermore, the household benefit of seeing lower interest rates and being able to refinance to save money also has reduced leverage as interest rates decline. Take two households 3 years apart, the first had 12% to qualify and the second had 10% to qualify. Say the rate declines 2% for each. So, the home was not bid up for the 12% buyer and the mortgage was $243k and the payments were $2500/month. To simplify, lets say the very next day they homeowner was able to lock in at 10% instead. Keeping their payments the same, they drop down from a 360-month amortization to a 200-month amortization. This is the stuff that stimulated the economy with initially dropping interest rates. That 2% decline in interest with the homeowner just maintaining their payment saves them a whopping $400k of interest.
Now look at the homeowner that came along three years later when rates were 10%. Home price got bid up to $285k, but they get the same lucky deal where the very next day they get to lock in 2% less at 8%. They kept their payment the same as well. They benefit, but their amortization only reduces to 214 months. Their savings in interest is $365k, still very good, but that is almost a 10% decline in leverage for savings. At 8% that declines to 6% the amortization declines to 228 months for $330k savings, and 6% that declines to 4% has an amortization decline to 243 months for a $293k savings.
So, when interest rates first went down there was huge amounts of money to be saved through households easily being able to reduce their total payments due to most of the payment stream being interest. That money was freed up and available to stimulate the economy, but at the same time, anyone not in the market ended up in a housing market that got bid up based on payments that could be paid at lower interest rates.
The lower the interest rates when entering the housing market, the more burdensome the nature of the debt to be repaid. Whereas for existing home owners lower rates offered enormous leverage for savings on mortgage payments and enormous ability to free up capital, the utter opposite is true for those who have entered the housing market later at lower rates. There is a gross decline in leverage to control and tackle debt and there is forever a reduce ability to free up cash for other things. By changing the terms of second mortgages from 10-years to 30-years newer buyers don’t even have eliminating the second mortgage as a source of freeing up cash flow.
Each year this lower-interest-rate with negligent-lending-standards time-bomb has continued it has resulted in more and more people with debt that gives little leverage to improve your financial position and it is the suck-the-life-out-of-your-financial-future-forever kind of debt.
So, the economy is now in a place where there isn’t must left to stimulate the economy from reducing interest rates, but there are an enormous number of homeowners with grossly reduced prospects of managing debt because of all the ways leverage has worked against them:
1) Homes bid up in price due to rate declines
2) Reduced leverage from increasing payments
3) Loss of equity from declining home prices
4) Reduced leverage of saving should rate decline
5) Homes bid up in price due to second mortgage term increasing
6) Homes bid up due to allowing a higher percentage of income to qualify for the loan.
Early homeowners have already reaped the rewards of lower interest rates although some of them have probably painted themselves into the same corner of debt despair and destroyed their economic future as well by saddling themselves with the economic slavery kind of debt in order to upgrade their home or whatever else they might have wanted.
Housing Affordability
To further put this into perspective, out of 159 cities/suburbs in the world ranked for affordability, the US has 14 of the 25 cities in the world deemed to be the most unaffordable, including Los Angeles, San Diego, Honolulu, San Francisco, Ventura County, Stockton, San Jose, Riverside-San Bernardino, Miami, Modesto, Fresno, New York, Sacramento, and Sarasota. Add the population in each city and that is an enormous number of Americans that have potentially become debt slaves. Additionally, median affordability multiple for the US is now 3.7, meaning half the cities looked at have a lower level of affordability and half have a higher level of affordability. Out of the 107 US cities looked at only 35 are affordable, or median home price to median income is 3 or less.
Suffice to say that various leverage of mortgage debt is currently hurting home owners enormously in how home prices have been bid up to what they can “afford” with negligent lending standards. Homeowners have less power to control and reduce debt and that power has been declining as interest rates have been declining. Lower interest rates only helped those with existing debt that were able to refinance at a lower rate. Each percent decline in interest rate provides less leverage for reducing total interest payments when homeowners refinance. Interest rates have been low long enough that dire hazards to homeowners from the many levels of reduce leverage for getting ahead likely out weigh the initial benefits early home owners had in being able to reduce total interest payments and free that money up to spend in the economy.
Today’s newer homeowners have marginal prospects of being able to save for retirement, save for their children’s university, replace their aging vehicles, and indeed keeping their home should unplanned expenses or events happen such a job layoff, marital breakdown, health problems or unexpected pregnancy.
How Have Rates Declined?
For this part my reading took me to a federal report mentioned on Calculated Risk. In the report is a graph showing the weighted average mortgage rates from 1991 to 1994: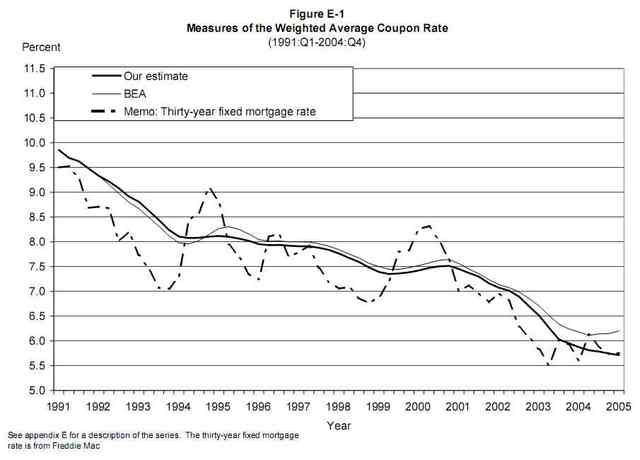
In the 14 years covered you can see the 30 year fixed mortgage rate go from a high of 9.5% to a low of 5.5%. Say a household had $100k of income in 91. They would qualify for about $297k of mortgage. In 2005 they would qualify for about $440k, an increase of 48%.
In 91, 64% of the repayment amount would have been interest, but at 5.5% only 50% is interest. Paying less interest is great when the principal amount is reasonable, but in both examples the repayment amount over the life of the mortgage is $900k and the low interest borrower has reduced leverage for reducing the interest paid from making extra payment.
Over 14 years if you assumed wages have increased by 2.5% per year, then in 1991 that $100k salary today would have been about $70k. So in 1991 the amount of mortgage 30% of income would have qualified for at 9.5% interest would be $208k. With the rate decline and the wage increase over the 14 years then in 2005 that same household would qualify for $440k, an increase of 112%, or 5.5% per year.
In Canada to qualify for an insurance-free mortgage you need 25% down for a 25-year mortgage. In this model, if you consider that decreasing the interest rates and not building in anything for the extra risk due to how the nature of the debt has changed, over 14 years wages only went up about 40%, yet real estate is up 112%. If home prices were to return to that historical standard of debt risk housing would have to come down 30% and that 25% prime mortgage would be 5% under. The old US standard of 20% down and a 30-year mortgage was already a lenient standard.
How Do Low Rates Affect the Down Payment?
To merely go back to the lenient standard of 20% down is enormously different in a low interest rate environment. Say a household is able to save 15% of their gross income per year, which tends to be a fairly aggressive savings rate. In 1991 at $70k per year they could save $10.5k per year. A property that costs $260k would require $52k down and a $208k mortgage. This is a moderately unaffordable home, with a price to income ratio of 3.7. As I stated earlier, made no mistake that qualifying for a mortgage with 30% of income means that family budgets are tight. It would take this household almost 5 years to save the $52k down payment. In that time because of increasing income and declining interest rates, by 1996 the family would qualify for $272k, but the home would have gone up to $340k and now a $68k down payment is required. In 5 years with pay raises and 15% savings the household would be able to save $56k.
Decreasing interest rates "screwed" the potential new home owner yet again.
Fixed Percent Income to Debt Servicing Is a Changing Standard.
The changes to the lending standards, and there is no question that allowing a family to qualify for a mortgage with 30% of household income in a declining rate environment is a changing lending standard that dramatically increases the risk of the loan, punished the responsible in that real estate went up $80k went they were only able to save $56k saving fairly aggressively. Why not just hit the responsible over the head with a sledge hammer? The trend to lower interest rates ultimately punished those who were doing their best to be responsible. It also punished those who were not already in the housing market, a form of transference of wealth from youth to age.
Ultimately, a young family starting their working career in 1991 would need 7 years of saving 15% per year to catch up with the 20% down payment and by 1998 they would be able to afford a $370k home with a mortgage of $296k, and have needed a $74k down payment. So, 25 when you finish university, 32 when you buy your first home, and 62 when you finally pay it off, and in a low inflation fairly flat wage environment, and the increasing costs of perhaps having a growing family, means that money is tight forever. Consumer spending to stimulate the economy has been executed.
Today a family starting out with $100k in income that qualifies for a $440k mortgage because of the insane lending standards needs to save $110k towards a down payment. When the 1991 family would have first did their budget, they would have figured it would take about 5 years to save a down payment. Today's family saving 15% of $100k would need about 7.5 years to save a down payment. A home that costs $550k on a $100k salary is severely unaffordable. By the time this family got $110k saved, without a correction and say homes continuing up at the rate of wage increases, in 7.5 years home prices would increase another 20%, so they would ultimately need about 10 years to save a down payment.
I did not understand the degree to which the rules were being changed prior to my own entry into the housing market. Nor did I understand the degree to which these changing rules have mislead people in their belief about housing. The lowering of interest rates without adjusting either the qualifying term or percent of income was a grossly uneven playing field for the have no home compared to the have a home families. As I have stated previously in my blog, in Vancouver, it has resulted in an enormous division of wealth. I see people getting close to 40 who have not been able to make a dent in their student loans, never mind ever owing a home. The asset price inflation has also resulted in rent increases beyond the rate of wage increases so these people have had no buffer what-so-ever to the cost of living increases.
For 10 years in Vancouver our housing affordability index was probably around 4, maybe just over 4 in 1992-1996 and perhaps as low as 3.6 before our latest housing boom that started around 2001. Our housing prices declined a little from our peak around 1993-1995, and wages went up slightly which resulted in the affordability index declining. What I see in Vancouver's economy is a 10 year window of how unaffordable housing has played out in a relatively flat wage environment.
Additionally, those who had homes had a leverage of disposable income due to being able to refinance debt at lower rates, so renters faced grossly increasing housing costs due to increases in rent whereas home owners saw mortgage payments decline. Probably the difference in Canadian laws prevented Canadians from using their homes like an ATM machines that has occurred in the US.
The median housing affordability index for the US is 3.7. Those that had their homes and had the opportunity to have a buffer against rising costs through home ownership seemed to have squandered that advantage as US data indicates enormous numbers of people have borrowed against their homes despite having had the opportunity to become home owners when housing was affordable. It seems to me that far more people in the US have borrowed to unaffordable levels than what I've seen in Vancouver and I can't see how this does anything but suck the life out of the economy as the burden of dealing with household debt can no longer be put off. Wages can't be anything but flat in this kind of environment, and can be declining. We saw lots of declining wages through that period as well.
We are being warned about losses from mortgage backed securities and it seems to me the analysis of how this will play through the economy is only looking at how business losses have played out through the economy in the past. It does not appear to be looking at how stifled consumers will be for the long term because of the nature of how the debt structure has change, gross reduction of empowerment to pay off debt.
According to Calculated risk there is about $21 trillion in real estate assets, which if there is a 15% overall decline in real estate prices would be about $3 trillion in lost equity.
They also have two graphs in the post, Household Percent Equity, which would decline from 50% to 42% should home prices decline 15%. Equity would decline to 30% should home prices decline 30%.
The other graph shows home values and mortgage as a percentage of GDP. House hold value peaked at about 153% of GDP, whereas as it was typically valued at 80-90% of GDP. Mortgage debt is about 75% of GDP whereas it typically used to be about 30% of GDP prior to the credit bubble being launched in the 1980s. Should homes decline by 15% they would decline to about 130% of GDP.
Read More......