Goldcorp: The Oxymoron of Fiat Creation
Goldcorp has taught me a lot about what can be hidden in a stock. When I look at the dynamics of what drives a gold stock, the gross irony of Goldcorp is that, from my point of view, it is the epiphany of investor fears that is driving the gold bull in the first place.
So, just what are investor fears driving the gold market? The answer I get is currency devaluation due to government just printing more money. As the money supply grows, there is an escalation of inflation. The U.S. national debt is so enormous, printing money to pay bills seems more likely, so this is a serious and valid concern. Governments printing money is the cause of hyper-inflation.
Gold is supposed to be protective against this. Gold should hold its value against other currencies. This makes a certain amount of sense, however, gold stocks are not gold. They represent business that mines gold. They do not mine the gold and just sell enough to cover expenses and then save the hard asset that is supposed to protect valuation; no, they tend to sell all that they mine, paralleling the gold bug complaint that the gold that used to back currency has been sold off.
Gold companies do not print money, however, they do print stocks. Stocks are to a business what currency is to a country. If a business is printing stock, or issuing new equity, it is very comparable to government printing more money.
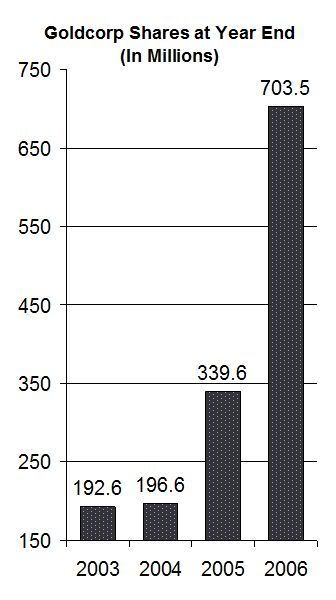
Just How Many Shares Has Goldcorp Printed?
The graph below show just how frivolous Goldcorp is with issuing new equity, options and warrants. Options and warrants are included and must be included to get a true picture of a company.
Dilution is easily hidden. It can be found, but it really doesn't show up in a chart of the company's performance, like this one on Goldcorp's share price:
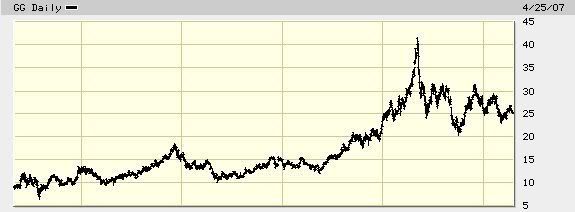
A chart of a company's share price completely and utterly hides dilution. To see a true picture of performance, you really need to look at a graph of fully diluted market cap. But where do you get that? As far as I can tell, it just doesn't exist, but it is probably one of the strongest pictures of how the market is valuing a stock.
There is no way that I can go back and figure out fully diluted share/warrant/option count on a daily basis and multiply it by the share price, but, I could do it for 10 points, say at the end of each year.
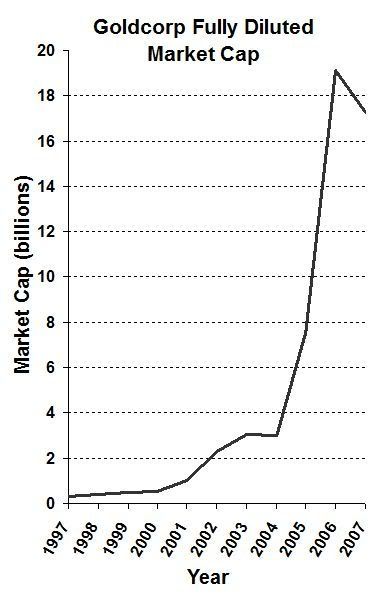
There were events tied to issuing of new equity. Some was to pay back debt, much like how governments have printed currency to pay back loans. Other events were asset acquisition, such as the take over of Glamis.
The midas touch, $6 billion of fiat book value in a single deal
Glamis was a gold producing company with a good development property. Their book value in their Q3 financial report before the takeover was $2.2 billion dollars. When Goldcorp took over Glamis the cash and equity value of what they issued was $8.2 billion dollars, and Goldcorp now carries $8.2 billion dollars in assets on their books for the Glamis properties.
Essentially, Goldcorp has a hyper-inflation of asset valuation being carried on their books. As assets are mined from the ground, an appropriate allocation of book value for each mine is written off.
The hyper-inflated Glamis assets are currently mostly non-producing assets, so what is currently written down is tiny compared to the total asset picture of Goldcorp, and it is tiny compared to the relative book value that the company is carrying for all of its properties. Once these assets start producing the writing down of the fair allocation of book value of these hyper-inflated assets will implode earnings.
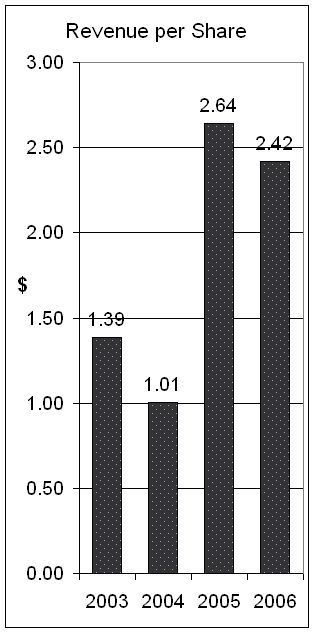
I find that Goldcorp is masterful at taking the focus from what ought to be the first priority for investors and and spinning impotent results into a good story. For example, look at the graph of revenue. It tells a stellar growth story, but merely looking back at the total share count suggests the revenue growth is inadequate compared to the equity growth.
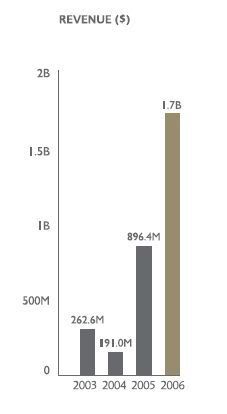
Indeed, the revenue per share has actually declined.
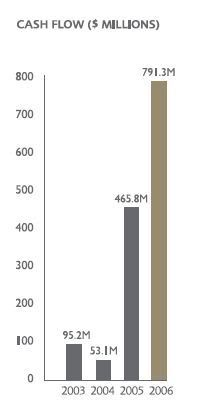
But again, the per share picture isn't so pretty, it is actually down 22%.
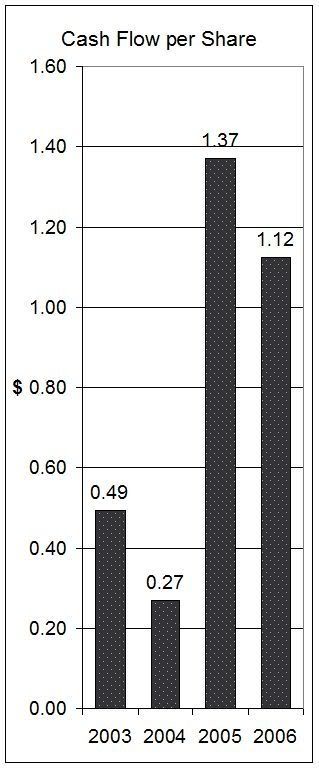
But not to be disuaded, I decided to look at the next "Go Goldcorp!" graph, which was earnings, and again, their presentation looks stellar.
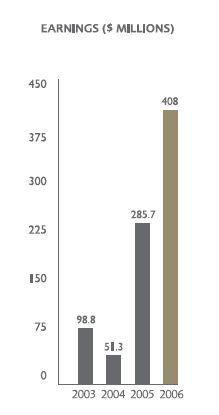
When you use Goldcorp's numbers for individual shareholders, it actually does look like an improvement.
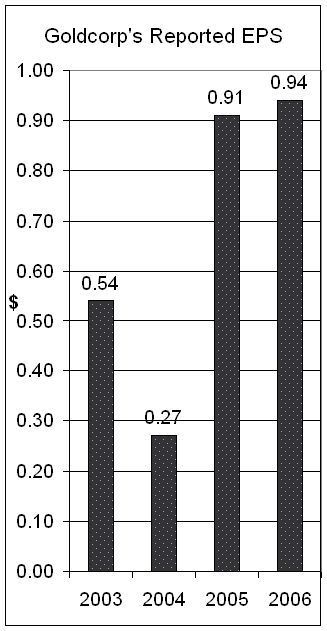
But I check calculations for myself I found $408 million in earnings when there were 703.5 million shares fully diluted did not "add" up to what they report. Practically none of the effects of share dilution and fiat book value from the Glamis merger show up in the financial reports. I took the earnings and the fully diluted share count at year end and re-plotted the data. This is ultimately what share holders are getting.
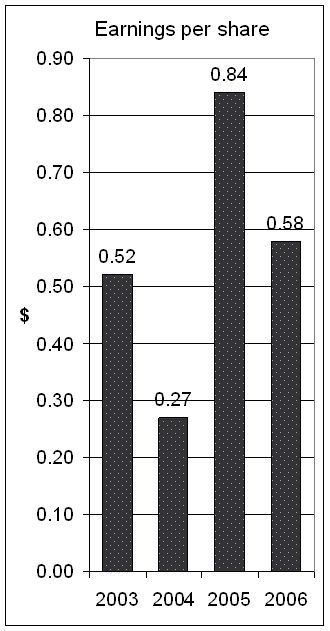
In 2003 with 52c eps Goldcorp was trading under $16.Goldcorp also puts its spin on gold production based on ounces for the company as a whole.
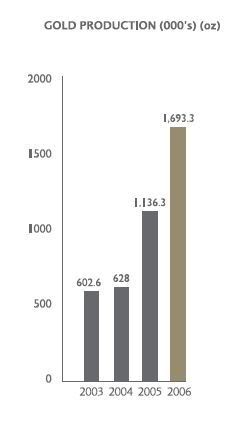
But, what Goldcorp is producing per share is far more important. The graph below is actually per 1000 shares, and the 2007 point is projected production. Already for 2007 production has been down graded twice from 2.8 million ounces.
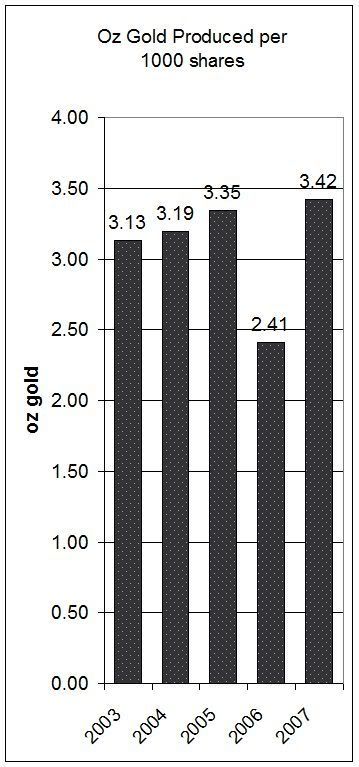
The 2006 figure has totally imploded. With about $24,000 US investment you can expect to see about 2.4 ounces of gold produced. It begs the question, how can anyone possibly think that this is reasonable? If they meet their targets for 2007, the gold production per share will return to the historical levels.
All in all, Goldcorp belongs to the honor role for the frivolous cap of fiat creation.
Read More......

