Saturday, June 30, 2007

Yamana, Northern Orion, and Meridian Gold Merger

Northern Orion first got my attention last fall when it was trading at about $4 Canadian at the beginning of October 2006, and given its under valuation, the upward march in October made sense. Then it gradually declined, again touching just under the $4 mark at the beginning of January.

It was during that descent that I started to contrast how it was being valued relatively in the market to ensure my perspective was reasonable and because of the joint ownership of the Alumbrera mine, Goldcorp was the most logical company to contrast relative valuations. The result was How I discovered the Gold Bubble and I came to the conclusion that Northern OrionLoading... was a buy to $7 based on its property holdings.

Wednesday’s joint news release announces a proposal to merger between Yamana Gold, and Northern OrionLoading... with an offer for Meridian Gold to be a part of the deal. The effective price for Northern OrionLoading... is $7.07 per share, a 21.3% premium over the day’s closing price, the same valuation that I came up with for Northern OrionLoading... without development of the Auga Rica property.

Northern Orion also has two types of warrants. The regular warrant holders closed at $4/share on Wednesday, so with an exercise price of $2, they have a 27% premium on the close, and still have until May 29, 2008 to exercise their warrants. The A warrants were not “in the money” warrants. They are exercisable until February 17, 2010. If Northern Orion managed to get their Auga Rica property developed in time for the A warrants, the roughly 600% growth in production meant that those out of the money warrants had a potentially very nice risk-reward ratio. The A warrants transfer to buy 0.543 of a Yamana share for $6. It means that Yamana’s share value must increase to $14.42, or $1.40 over the $13.02 close, in order for the A warrants to be in the money at their $1.83 price. Without this offer Northern Orion’s share price would have to increase $2 to $7.83 for the A warrants to be in the money. Relatively speaking, before the deal Northern Orion’s shares had to increase 34% to break even and at the time of the press release Yamana’s shares have to increase by 11% to break even.

But, that was before today’s Yamana’s share price declined. With the decline to $11.83 the take-over price works out to $6.42 for Northern Orion, and for the A warrants the Yamana share price needs to increase 23% to $14.54 to be in the money from today’s $1.90 close.

Before any merger fully diluted Yamana Gold has 381.9 million shares. The merge adds 309.4 million shares for shares and if all Northern Orion warrants and options were exercised, another 37.5 million. A real plus for Meridan Gold is they state they’ve only had 36% stock dilution compared to an average of 417% among their peers since 2000. There appears to be only an extra 820,830 options, so very little dilution. If all options were exercised there would be an additional 1.8 million shares, for a total of 730.6 million shares. Going with Wednesday’s close of $13.02, that would give a fully diluted market cap of $9.5 billion, which has declined to $8.6 billion with today’s price decline.

Production

So, putting together the total of the three company’s production, and you have:

Northern Orion

  • Alumbrera, Argentina, about 50 million pounds of copper, 75,000 oz gold
Northern Orion can expect about $160 million of gross revenue, Q1 gross sales were $34.8 million. The royalty that kicked last year is costing 96c/lb of copper for Q1.

Meridian Gold
  • Rossi/Storm JV, Nevada, 25,000 oz gold for 2007, 30-40,000 oz for 2008
  • El Penon, Chili, 230,000 oz gold, 6 million oz silver
  • Minera Florida, Chili, 70,000 oz gold
  • Zinc production, 8 million pounds, my estimate from Q1 financial report
Meridian Gold can expect about $300 million gross revenue, Q1 gross sales were $66.4 million.
Yamana
  • 600,000 oz gold, 140 million pounds of copper.
Yamana can expect about $840 million gross revenue, Q1’s gross were $145.1 million.
Combined production is about 1 million ounces gold, 6 million ounces silver, 8 million pounds zinc and 190 million pounds of copper. At $650/oz for gold, $12.50/oz for silver, $1.50/lb for zinc and $3.20/lb for copper it gives about $1.3 billion in gross sales without hedges.
Q1 earnings were $27.4 million for Yamana, $9.5 million for Northern Orion, and $18.9 million for Meridian Gold, or $55.8 million.
Quality of Reserves
Grade quality of reserves and resources must also be considered.
Yamana
At December 2006 Yamana had 6.9 million ounces of gold at 0.49 g/ton, or metal values of $10/ton. Additionally there is 2.3 billion pounds of copper at 0.35% or about $25/ton. As some of the copper metal values overlap with the gold, weighted average metal values of copper and gold combined work out to $28/ton. The 13.7 million ounce of gold and 2.8 billion pounds of copper in the mineral resource has smaller average metal values, about $23/ton.
If you could master 100% recovery, at these grades you need to mine over 63 tonnes of ore to produce a single ounce of gold with 0.49 g/ton. Chances are they have higher grade veins to mine first, but the sheer magnitude of the amount of ore per ounce of gold suggests high production costs, or grossly increasing production costs as the grade mined declines.
To put it into perspective, the Chapada property has both the copper and gold and its metal values work out to $37/ton in the proven reserves and $30/ton in the probable reserves, essentially a 20% decline in metal values as the mine life proceeds and they move from mining the proven reserves to the probable reserves. At 0.34 g/ton 92 tonnes of ore must be mined for an ounce of gold. Take the grade down to the 0.26 g/ton and you need 120 tonnes of ore. Compounding this problem is that recovery rates also tend to decline as the grade declines, so where you might have had 90% recovery, you now have 80 or 85% recovery, the 92 tonnes required becomes 102 tonnes required at 90% recovery and the 120 tonnes required becomes 142 tonnes at 85% recovery.
You can take copper production and take those dollars and apply them to gold production and give the appearance of low cost gold production, but what you’ve essentially done is allow copper production to trade at gold multiples. With Q1/07 dilute earnings of 7c/share multiplied forward by 4 quarters you get 28c/share. That gives a P/E of 46, so copper sales are trading at a P/E multiple of 46.
Looking further, for Q1 the Chapada mine produced 38,954 oz gold and 27.5 million pounds of copper. That is about 32% of the gold production. Chapada was responsible for 60.6% of the net revenue, which leveraged to 87.4% of the operating earnings. That detail screams that the other mines are not making much money. For Q1 the grade mined at Chapada was 0.57 g/ton gold and 0.47% copper, the metal values per tonne mined were $45/ton, way more than the $37/ton metal values for the remainder of the proven reserves, and the $30/ton of the probable reserves.
Northern Orion
Alumbrera has a life of mine until 2016 and has 0.45% copper, 0.014% molybdenum and 0.47g/ton of gold for metal values of about $51/ton. Alumbrera has a 20% royalty that kicked in last year.
Agua Rica has reserves of 0.50% copper, 0.033% molybdenum and 0.23g/ton gold for metal values of about $61/ton. The Agua reserve has 8 billion pounds contained copper, 531 million pounds molybdenum and 5.4 million ounces of gold.
Meridian Gold
Meridian’s El Penon is stellar, 6.6 g/ton of gold and 275 g/ton of silver in the proven and probable reserves. At $640/oz for gold and $12/oz for silver, that’s a very nice $242/ton in metal values.
Minera Florida has 1.5% zinc, 27 g/ton silver and 5.3 g/ton gold for $169/ton metal values.
Rossi has a resource grade of 15.4 g/ton of gold for $317/ton, but the deposit is very small.
Esquel is has a stellar grade of 23g/ton of silver and 15g/ton of gold for $317/ton.
Of the three, Meridian Gold has the smallest reserve/resource contribution, but it has more profitable grades, even for the more costly underground mining.
The Growth Profile
Checking out their presentation, the two-year plan is to move from 1 million ounces of production this year to 1.5 million ounce by 2009, or a 50% increase in gold production. Say gold is $650/oz, that’s an extra $325 million/year of gross revenue. A move from 1 million ounces to 1.5 million ounces would only increase the gross revenue by about 25% as about half the revenue is from the zinc, copper and silver. There may be plans to increase production of these metals, but that information was not included in their presentation.
The increased production plan does not include developing Agua Rica, or Esquel. Agua Rica has a feasibility study to produce 365 million pounds of copper, 125,000 oz of gold and 16 million pounds of molybdenum. Say copper was $2/lb and molybdenum was $15/lb and gold $700/oz, that would give $1 billion of gross revenue. There would be no outrageous 96c/lb royalty on this production. There could also be the option of partnering with Alumbrera for some other kind of production arrangements as they are close together.
Conclusion
Just because you label a company a gold producer or a base metal producer is not justification to accept different valuations for producing an identical product, such as copper, silver and zinc and for Yamana the market is grossly overvaluing production from producing these metals in comparison to if they’d been produced by say, Quadra.
Also, the market tends to fail to adjust valuation for reserves based on the quality of the reserves. The low metal values per ton for Yamana suggest that the reserves should be valued at a significant discount when you consider that the mining costs per ton tend to be fairly fixed costs. When grades are $50/ton, $10 processing per ton is 20%. At $25/ton it is 40%.
The gold grades are low and the actual production costs without metals credits are high. When Chapada’s costs are fairly allocated between copper and gold you get 66c/lb production costs for copper and $187/oz for gold.
Yamana is sufficiently overvalued that the “premium” offered to Northern Orionand Meridian is completely fiat.
Do your own due diligence, these are strictly my opinions. For the record, I owned Northern Orion until I realized it could very well be taken over by some bubble-valued gold producer.

Read More......
Tuesday, June 19, 2007

Bingham Canyon Mine – The World’s Largest Copper Mine

Mining has a rich history and the Bingham Canyon mine has one of the richest histories. Operating since 1906, it is the world’s first open pit mining operation and it showed the world how to mine low-grade minerals profitably.


Photo Sharing and Video Hosting at Photobucket
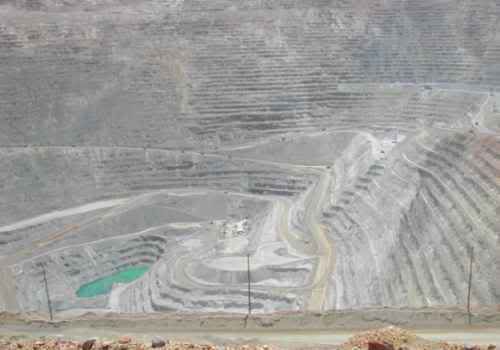
In 1906 there was a 9000 ft mountain. The mine is now ¾ of a mile deep.


In the late 1800s a man named Daniel Jackling first got the idea that perhaps copper could be mined from the surface if the operation was big enough. Old time miners in the region thought he was crazy to even consider trying to mine such a low grade, which was a mere 2% or about 38 lbs/ton. Today that grade, about $120/ton at today’s prices, would be considered very good by open pit copper mining standards. The original goal was to mine 2000 tons per day, which a quick calculation suggests about a 25 million pound per year when operations started in 1906. It wasn’t long before the Bingham Canyon mine was the only mining operation in the region.

In 2006 the grade mined was 0.63% copper, 0.057% molybdenum, with 0.49 g/ton gold and 3.5 g/ton silver. At today’s prices that’s $90/ton metal values. In 2006 Bingham mined concentrates that contained about 580 million pounds of copper, 37 million pounds of molybdenum, 523,000 oz gold, and 4.2 million oz silver, about 17% US copper production. The smelter was shut for 63 days so only about 90% of the concentrate was refined.

Bingham Canyon mine claims to be the world’s biggest mine, as does Escondida in Chili. Who’s telling the truth? Escondida currently has the largest production in the world, about 2.8 billion pounds per year, 8.1% of the world’s copper production, and its production is more than 100 times Bingham 1906 initial production. Started in 1990 at 6-700 million pounds per year, Escondida has not produced the most copper in the world, that title belongs to Bingham Canyon.

To put into perspective how much mining has happened at Bingham Canyon over the last 100 years when Daniel Jackling first built his mine there was a 9000 ft high mountain and now there is a hole ¾ of a mile deep and 2.5 miles across the top, 500 miles of roads in the pit and it has produced over 17 billion pounds of copper.

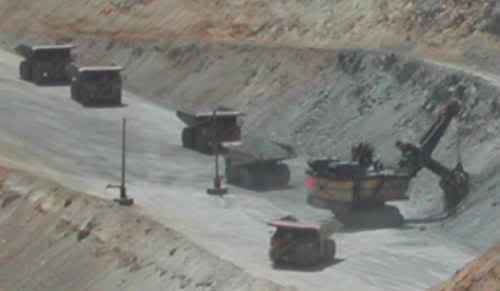
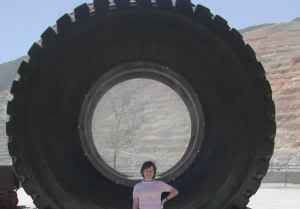
Bingham Canyon mine uses some of the most equipment today. The shovel weighs 2.5 million pounds and pick up 98 tons with a single scoop. The trucks carry between 255 and 350 tons of rock.

Photo Sharing and Video Hosting at Photobucket
The trucks and shovel look small until you look at the tires.


The mine has been highly profitable and been described as “the richest hole on the Earth.” It is operated by Kenncott Utah Copper, which is owned by Rio Tinto. Of the $7.4 billion in profits that Rio Tinto had in 2006, about $1.8 billion came from Kenncott Utah Copper.

The life of the mine is currently projected until 2017 with reserves of 0.54% copper, 0.043% molybdenum, 0.32 g/ton gold and 2.59 g/ton silver, or about 18% less metal values per ton mined in 2006. The declining reserve grades does mean that profitability will decline and Bingham Canyon Mine’s centennial year (2006) may also go down as its most profitable year in its history. Future considerations after the open pit operations come to an end is to consider the economics of under ground mining for metal resource that can not be reached through open pit operations.

To evaluate if Bingham Canyon mine is a good investment, investors need to check out Rio Tinto. It trades in the ADR under the ticker RTP.

Rio Tinto has a market cap of $113 billion. Sales in 2006 were $25.4 billion and earnings were $7.338 billion, or about 6.5% of the market cap. Reinvestment for capital projects in 2006 was $3.9 billion, with $1.1 billion of that financed through increasing debt.

The copper group made 49% of the 2006 earnings, with Bingham and a 30% ownership of Escondida being the two largest contributors to the copper revenues. Escondida has a life-of-mine that should go 25-30 years. Depending on the grade an economic feasibility to switching to under ground mining, Bingham’s revenue stream may need to be replaced in the next decade and Rio Tinto has interests in 4 world-class undeveloped projects in the works to start in 4-10 years that will meet that objective:

  • 100% ownership of La Gradja in Peru.
  • 9.95% increasing to 19.9% interest in Oyu Tolgoi (Turquoise Hill), in Mongolia.
  • 19.8% interest in Pepple in Alaska.
  • 55% interest of Resolution Copper, 2 km deep.
Rio Tinto has a diverse holding of properties, diamonds, alumina, aluminum, coal, iron, uranium, and titanium in many countries in the world. Reports are in US currency. To quote from Rio Tinto’s 2007 outlook published in February:

Since January 2003 strong appreciation against the US dollar has been seen in the Brazilian Real (61%), Australian dollar (37%) and the Canadian dollar (32%). This in turn has increased mining production costs as denominated in US currency.

US currency has declined further since that report, further putting upward pressure on production costs as they are reported in US currency. This puts downward pressure on earnings.

Furthermore, commodity prices were very strong in 2006, and with strong prices there is more risk for price declines. With a company as big as Rio Tinto mines are constantly coming to the end of their mine life, so there is a constant need for replacement projects to maintain operations, never mind increasing operations. Rio Tinto’s $3.9 billion in capital projects demonstrates that they are focused on ensuring a strong production profile.

A problem for Rio Tinto that a small company does not have is that it is so big, any meaningful production growth can be offset by declines in price because relative meaningful increases in production relative to their size affects the supply to the point it can push prices down. For example increasing Rio Tinto’s copper production by 10%, say around 200 million pounds, and that would increase world supply by about 0.5%. A small company’s existing production might only be 100 million pounds, so that increase would triple their production, or increase by 200%. Rio Tinto’s relative increased production is so small, so it gives little protection from downward price risks compared to the small company. The downward prices risks would be enormous if Rio Tinto tried to double their production.

There is no question that Rio Tinto is an amazing company with exceptional management that pays attention to not diluting the share count, but with strong commodity prices investors have not properly considered what happens to their investment if commodity prices decline. It simply isn’t wise to price a big commodity company above a P/E of about 12.

Read More......

Tuesday, June 12, 2007

Looking at the Income Trusts

Income Trusts - Park Your Money Investments, looked at a list of income trusts on a site promoting them as having very high growth potential, plus a couple that I knew about that had dividend high yields.

On a very simple assumption that dividend yields would remain the same and the market would value the trusts equally, I did a calculation on how much they could potentially grow, and made it clear that no fundamentals had been looked at.

In A Closer Look at Two Income Trusts the top two picks off that web site were looked at closer, and there was more information about about how the list was derive, and it was based on previous growth. So, one of the trusts had enormous "growth" from a buyout and was finished. The other was a declining business and at risk of reducing the dividend it they did not get things turned around. The decline was slow, but a shrinking business should demand a premium dividend rate.

On May 24th the TSX opened at 14,173 and it has declined to 13,724 since that post, or 3.27%. To buy one share each of those stocks would have cost $570.04. They have declined by 2.54%, to $555.58, but some have paid a dividend, for $2.15 on 17 of the stocks. The dividend reduces the loss to 2.21%.

The biggest decliner was Faircourt Management Inc, FIG.UN, by 15%, although the dividend reduces that to 14.3%. So, just what is this Faircourt? Faircourt is a an income trust fund with about 60 different holdings. It has assets of almost $110 million.

Their web site shows their holdings. In 2006 they got $10.8 million in distributions from the holdings. There was $5.8 million in expenses. Read the report and the management fee states it is 1.1% for one thing and then an additional 0.4% management fee. But then there is an additional $330k for some service fee, and $65k for audit, trustee and legal fees. Then there are reporting costs, record keeping fees, custodial fees, administrative fees, interest and bank charges and interest on preferred securities. It seems there is an awful lot of money being used to push paper that would be avoided by simply buying the a few of the holding directly.

My simple extrapolation from the dividend suggested this one would make about 3% over the year, and that's including the dividend, meaning the share price would go down.

That's a 3rd one to scratch from the list, at least as far as my investment decisions go.

Read More......

Saturday, June 09, 2007

Commodity Prices - The 50-year low and 20-year average

In 2002 commodity prices were at a 50-year low, and with zinc, for example, the price was about half of the 20-year average price.

That 20-year average price was mostly in a bear cycle. Bear cycles lead to under investment. Existing mining companies are sustain operations without replacement investment. For example, the mines are already built; so only maintenance costs required. They already have drill results telling them where to mine, so exploration budgets can be cut, and that was happening. Individual mines depreciate in value as the minerals are mined and the life of the mine declines, so in real terms, without re-investment the value of mining companies was declining during the bear cycle.

Furthermore, if you look at what happened when prices hit that 50-year low in 2002, well, companies went into bankruptcy. Other companies sold off valuable assets at bargain basement prices. Look at how Roca (ROK-V), Northern Orion (NNO-T) and Eastern Platinum (ELR-T) all got started. The assets they control they got for probably 10c on the dollar.

Another example, Silver Wheaton purchased 37.5% of the Alumbrera mine in 2003 for $270.5 million, which was later acquired by Goldcorp. In 2006 that 37.5% interest accounted for $334 of the $455 million of operation earnings from the 15 mines listed with operations for Goldcorp. Alumbrera is in Argentina, where costs are relatively low and it was sold in a fire sale!

The mining industry in BC, where I live, practically died at those 20-year average prices, even where the mines were already built. And it was happening across Canada. Look at Teck Cominco’s (TCK.A-T) old Pine Point mine, the property now owned by Tamerlane (TAM-V). It was the site of one of Canada’s most profitable mines and it was shut down and practically given away with 70 million tonnes of historical, ie, not NI 43-101 compliant, resources with 1.59% lead and 4.19% zinc in 34 deposits. That is about 2.5 billion pounds of lead and 6.5 billion pounds of zinc.

Competition from countries with cheaper wages and costs played a significant roll in the demise of Canada’s mining industry. With those 20-year average prices gems were treated as pyrite. And that should be a wake up call for just how much relative value you should give to metals in the ground versus a company’s earnings in your own investment portfolio.

It seems to me that using that 20-year average price as a meter stick to come up with long term price projections is not reasonable given that it was a period of cannibalism of assets to maintain operations and I think that is partly why some analysts keep under estimating the strength of future commodity prices.

And, if you take a look around at what is happening in other countries that have developed a strong mining economy, the standard of living is rising, as are their wages. The proliferation of news releases about strikes is enormous, and wages are going up. The wage discrepancy is shrinking and the world is running out of countries where you can build a mine for slave labour wages.

And with increasing standards of living, when workers can actually participate in the economy rather than just exist in the economy, they stimulate the economy in a way that gives the enormous rates of economic growth that we are seeing in developing countries.

Those in the mining industry and those highly bullish on commodities insist that it will take years of new investment to meet current demand and that we are in a super cycle for commodities because of the gross level of under investment and because of the economic growth in developing countries. The bears of the market look at that 50-year low and the 20-year average price and use that as a meter.

There is no question that the high commodity prices we are seeing today are unsustainable in the long term, and the further out the prediction on where prices will be the more likely it will be wrong, but it makes far more sense to me that the next 20-year average price will be significantly higher than the previous 20-year average price.

Read More......

Thursday, June 07, 2007

Why Aren't You Saving -- The Death of a Bedrock Belief

The purpose of Low Interest Rates - As Destructive as Usury was to show how much less empowered people have become in their ability to get ahead by paying down debt through two mechanisms:

  1. Grossly reduced leverage of benefit of reducing total amount to be paid back from increasing payments.
  2. Low interest rates are because theoretically inflation is low, so wage increases are also low further disabling the ability to increase mortgage payments.
A third problem is revealed in Making Less Than Dad. The study points out that American men in their 30s are earning less than their father's generation, a 12% drop.

A significant point in the article states that American families had a 32% increase in income levels between 1964 and 1994. Move that forward by 10 years, from 1974 to 2004 household income growth slowed to 9%.

A "truth" I was repeatedly told when I was growing was that each generation does better than the generation before them, and article suggests the death of this bedrock belief, but I would suggest that belief has been dead a long time, through reduce earning power, as the article above shows and increased taxes that disproportionately burden younger people.

I became highly aware of the degree of the declining buying power when I was involved with the 1997 Census. I was shocked to often see 3 young adults sharing a one bed room apartment out of necessity.

That was not happening with my peer group when I was a young adult. You could afford to share a reasonable 2 bedroom or even a dumpy one bedroom on minimum wage. I worked in a bank so I saw what all occupations were paying and my wage was at the lower end of the wage spectrum. Sharing a two bedroom apartment cost me 15% of my gross income. I could fill my economical car's gas tank with one hour of wages. I had a girlfriend who supported herself in grade 12 renting a basement suite on working 20 hours per week.

I often bring up the declining buying power of minimum wage with students. "When I was a young adult minimum wage was $3.65 and my share of a two bedroom apartment was $112.50," I tell them and I get them to calculate how much minimum wage would have to be today to keep up. They will come up with about $13/hour.

I continue, "A course at Simon Fraser University cost $54 and today it is $453.30," and they calculate $31/hour.

And never mind the grossly reduced buying power, look also at the grossly increasing tax burden.

"You would have to pay $111 per year towards Canada Pension Plan, and you'd be at 57% of the maximum pensionable earning, today those at 57% of the maximum pensionable earnings pay $1066." Minimum wage would have to have gone up to $35 to have the same proportion of wages going to Canada Pension Plan. But, even on another issue, maximum pensionable earnings was 1.73x minimum wage and it is now 2.63 times minimum wage. At the very least, if minimum wage went up as much as the maximum pension amount it would be at $12/hour, but they be taking home way less because of the gross increase in pension contribution for low wage earners.

There is no question making less than dad grossly impacts on ability to work toward financial security, but I question how much the study corrected for how the tax system grossly favours the old over the young.

And they go on and on about the reduced savings rate...

Read More......

Tuesday, June 05, 2007

Richistan - The Ultimate Conspicious Consumption

Robert Frank has written a book titled Richistan: A Journey Through the American Wealth Boom and the Lives of the New Rich. There is a link to a radio interview with him about his book that is quite interesting.

One thing from the interview is that he is suggesting that there is a lot of consumption coming from these new rich, who got rich from what is referred to as a liquidity event, like starting a company and making millions on stock options or selling it. Anyway, companies that cater to the new rich will probably do very well in the next 10 years compared other retailers.

End of post, no more to read.

Read More......

Monday, June 04, 2007

Paladin Resources Ltd - A Near Term Uranium Producer

On my post on Cameco, which has little ability to take advantage of uranium spot prices because of long term hedge contracts, I was asked about uranium producers able to take advantage of the current spot prices like near term/new uranium producer Paladin.

Fully diluted Paladin Resources Ltd has 600,989,245 shares (May 14, 2007). Today it closed at $8.12 giving it a fully diluted market cap of $4.9 billion, or almost 1/4 of that of Cameco. For a near term or new producer investors have given Paladin a lot of valuation. Paladin Resources has a market cap about 17 times bigger than Roca, which is a near term molybdenum producer, and about 26 times bigger than Blue Note, which is a near term zinc producer. For a new producer Paladin has a very substantial market cap already.

Paladin new mines are Langer Heinrich, and Kayelekera. Kayelerkera is projected to reach full production of 3.3 million pounds in 2009 and Langer Heinrich 3.7 million in later 2008, for a total of 7 million pounds per year for 2010. 7.5 million pounds is committed to contracts from 2007 to 2012. Cumulative production to the end of 2012 is projected to be 31 million pounds and their reports all use a "conservative" price of $90/lb for Uranium to give $2.8 billion in revenues from now until the end of 2012, or 57% of the market cap. Keep in mind the "conservative" $90/lb is about 10 times the 2001 price of uranium and they do not reach their full production until 2010.

Langer Heinrich was officially opened March 15, 2007, and is currently operating at 70% of its "design capacity." It was projected to mine 2.6 million pounds for 2007, but is now expecting to be between 400,000 and 600,000 lbs by June 30th, and reaching that rate after June 30th, so about 1.8 million pounds for 2007.

Paladin does not give clear guidance as to how they get their 31 million pound production figure. My estimates are:

  • 2007 - 1.8 million pounds (Langer)
  • 2008 - 3.1 million pounds (Langer)
  • 2009 - 5.2 million pounds (3.7 Langer, 1.5 Kayelekera)
  • 2010 - 7 million pounds
  • 2011 - 7 million pounds
  • 2012 - 7 million pounds
This year's production at best will give 2007 gross revenue of $125*1.8 = $225 million, or about 4.5% of the market cap before any expenses. Paladin does have some hedge, the 7.5 million pounds over 5 years the banks required, but the price of the hedge is well hidden, so $225 million is mostly likely an over estimate of gross revenue.

For 2008 at $125/lb would be $388 million, and at $90/lb would be $279 million, 7.9% and 5.7% of market cap respectively.

For 2009 at $125/lb would be $650 million, and at $90/lb would be $468 million, 13.2% and 9.6% of market cap respectively.

For 2010 and beyond at $125/lb would be $875 million and at $90/lb would be $630 million, 17.9% and 12.9% of market cap respectively.

Out of that comes production costs, administrative costs, royalties, exploration, technical reports, stock based compensation, capital costs, maintenance, taxes and so on all have to be paid.

They have other projects they can develop, but they have to change some policy and laws to get approval.

On long term price, the further out you go, the more likely the prediction will be wrong and the bigger the gamble, either for upside or downside. What I found when searching long term predictions:

The same is true of Raymond James analyst Bart Jaworksi, whose latest estimates show an average uranium price of $90/pound for 2007 and an average of $100/pound for 2008 and 2009. But, Jaworski did not budge from his price forecast of an average uranium price of $60/pound for 2010.

Prices may average $100 a pound in 2007 before easing to $85 in 2008 and $75 in 2009, Toronto-based RBC Dominion Securities Inc. said Nov. 17.

The team at GSJBW seems to acknowledge all these risks. The broker has a long term price forecast of US$45/lb but the figure doesn't figure anywhere in the outlook for the next few years. Average U3O8 spot price forecast for calendar 2007 is US$90/lb, for next year it is US$95/lb, after which a gradual decline is assumed to US$80/lb. (2011 sees a rise to US$85/lb, however).
Paladin's "conservative" $90 average price is not conservative relative to analyst predictions. Using Jaworski's forecasts the average price assuming the $60 remains constant would be $74.44/lb. Using $125/lb for 2007 the RBC averages to $78.89. The third one averages to $85.23. $90/lb is not a conservative price, but a strong price. Use that $60/lb for 7 million pounds and gross revenue is a mere 8.6% of market cap.

Paladin currently has a very small production profile able to cash in on the current strong uranium prices.

Strong prices are simply vulnerable to downward price corrects and as prices become stronger valuation models need to become more conservative to take that into consideration. Paladin currently has a seriously inadequate production profile relative to market cap and even when their production growth plans are meet for 2010 the production profile is still highly marginal compared to their current market cap and is utterly crippled should prices decline.

Read More......