The Abundance of Minerals
In “Earth for Sale” I did a very rough calculation to determine the values of metals in the Earth’s crust for copper and uranium. The point of the post was that there are such enormous amounts of minerals in the ground, giving value to that which is in the ground at strong prices is imprudent, as that was the only “fundamental” behind the vertical ascent of uranium stocks.
This post will look closer at relative abundance of metals and how they are currently valued. I used the abundance values from Jefferson Lab and calculated the percent of the Earth’s crust each mineral would make up. I then calculated the volume of 1 km of the Earth’s crust taking the difference in volume of the Earth and a sphere 1km smaller. I used a density of 2.7g/cm^3 and 30% land area. For each metal I multiplied by the percent abundance and divided by either 454g for pounds or 31.1g for troy ounces and multiplied by the metal price.
Mineral Abundance % of Crust Spot Price
09/26/07"Value"
Aluminum 82300 ppm 8.2% $1.09/lb $8*10^19
Copper 60 ppm 0.006% $3.64/lb $2*10^17
Gold 4 ppb 0.0000004% $728/oz $4*10^16
Lead 14 ppm 0.0014% $1.60/lb $2*10^16
Molybdenum 1.2 ppm 0.00012% $32.25 /lb $3.5*10^16
Nickel 84 ppm 0.0084% $14.61 /lb $1*10^18
Palladium 15 ppb 0.0000015% $342/oz $7*10^16 Platinum 5 ppb 0.0000005% $1349/oz $9*10^16 Rhodium 1 ppb 0.0000001% $6225/oz $8*10^16 Silver 75 ppb 0.0000075% $12.53/oz $1.3*10^16 Zinc 70 ppm 0.007% $1.36/lb $9*10^16 Iridium 1 ppb 0.0000001% $450/oz $6*10^15 Uranium 2.7 ppm 0.00027% $85/lb $2*10^17
The “value” of metals in the Earth’s crust is grossly out of line with reality. The “value” of aluminum in the 1st km of the Earth’s crust is “worth” 80 quintillions (80 million trillions) – about 200,000 times the $415 trillion in derivative contracts that existed at the end of 2006. The lesson here is you are going to get in trouble with investments if you value metal equities based on what is in the ground. Not all minerals in the ground can be mined, but if you assumed only 1% of each mineral, or even 1/10th of 1% is recoverable, the numbers are still enormous. The metals of your commodity investment are only worth those prices if they make it to market and get sold at those prices.
Each mineral on the list is subject to supply and demand based on the mineral. Take a look going back 15 years at the price of Aluminum, which is the metal with the highest “value” in the Earth’s crust, and you see that the current price is about double the 15 year low.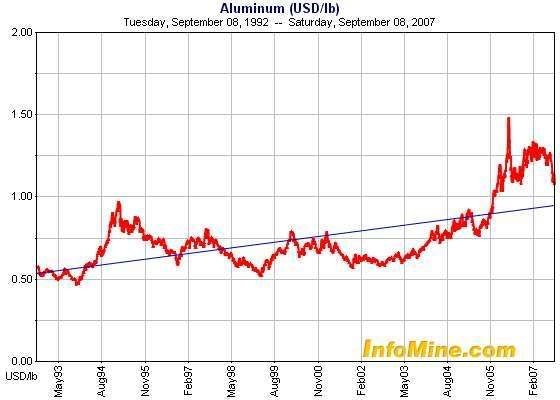
Aluminum has not done the same degree of outrageous price increases and spikes as other metals. I would suggest the reason is that there is so much aluminum, the market can respond far faster to under and over supply situations. At 8.2% of the earth’s crust, aluminum is a macro element. The price of aluminum temporarily spiked to about 3 times the 15-year-low. It is currently about double the price of 15 years ago. The current price is still on the strong side in comparison to historical prices, but if you think about it from just an inflation perspective, many things have doubled in the past 15 years.
Iridium, which is the least followed and known metal on the list, also has the smallest relative valuation. It has limited applications. It is the most corrosive resistant metal known. It is also tied with Rhodium in terms of how rare it is on Earth, yet Rhodium has about 14 times the price, and relative valuation in the Earth’s crust. The following graph shows that Rhodium was not always so dearly valued; it is up about 16x what it was just a few years ago.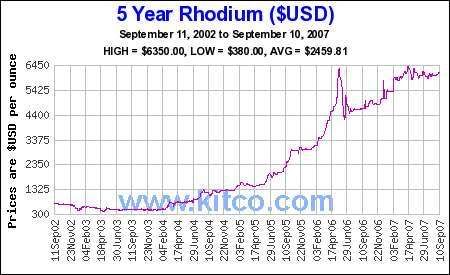
One has to ask if new applications and demand for rhodium really justify the increase. Rhodium tends to be mined with platinum group metals. Has world demand for rhodium increased that significantly relative to platinum? How sustainable is the demand at that price? I don’t know the answers, but I would be researching them if my investments were dependent on Rhodium price.
Nickel, uranium and copper are the next strongest valued metals. Nickel and uranium have had tremendous hype, hysteria, and speculation, very much like the tech boom of the late 90s. There is absolutely no shortage of these elements in the Earth’s crust, none what-so-ever.
Uranium consumption is about 150 million pounds per year. Say it increases 7-fold, to 1 billion pounds per year, and only 1/10th of 1% could be mined, well, that would mean the Earth has about a 2 thousand year supply. A price boom on uranium in the 70s resulted in about 50 years of uranium reserves being found. The current market is under 100,000 tons per year, which is very small compared to other metals. At the current rate that uranium is being used, current world resources would last 70 years. (http://www.uic.com.au/nip75.htm)
The shortage of uranium has nothing to do with its availability to in the ground, but rather the special licensing and controls that uranium mining is subject to do due to its inherently dangerous nature. Building uranium mines takes an extra 2-5 years longer than other mines because of the extra controls and safety concerns. Uranium spiked to about 13x its lows and as little as 2-3 years ago mining companies were bidding to supply uranium in the $10-15/lb range. Those who cash in on uranium will be those who enter long-term uranium contacts at higher prices, and those who are already in the process of building mines. The price of uranium will probably remain stronger for longer not because uranium deposits are unknown, but because the mines are not built and they take longer to build. When you consider the price was $10-15 just two to three years ago, even $40-50/lb is a very strong price.
Nickel is 1.4 times more abundant than copper and 30 times more abundant than Uranium in the Earth’s crust. The 15-year price chart for nickel shows it had a price around $3/lb, for years.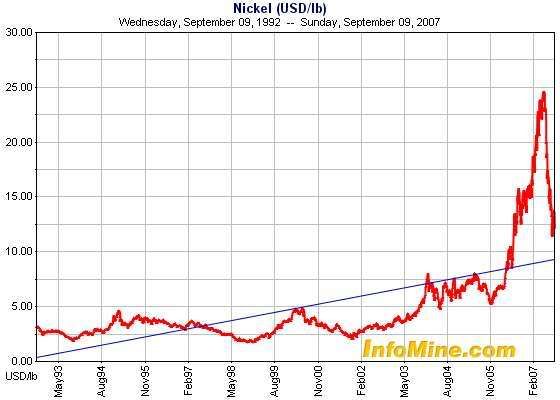
BHP’s financial results shows they made a good profit on nickel in 2006 at price around $7/lb and they more than tripled their earnings from nickel with nickel averaging around $20/lb. Nickel price is up because there was a supply squeeze, and it is unlikely that the price drop is finished when companies were able to make good profits at $7/lb. Nickel is highly abundant, and world demand is relatively small, about 1.5 million tonnes per year. Apparently some nickel supply is now coming from ore being imported into China and producing nickel at $8/lb. This new source of supply appears to be increasing rapidly.
Copper has a high value, but it has a much higher demand, about 16-18 million tonnes per year. This is about 10-12 times the demand of nickel. Relatively speaking, nickel has about 15x the abundance when contrasted to the relative size of world demand. Nickel completely lacks scarcity yet the price spiked to 8x that 10-year average price from about 93 to 03.
Copper price has spiked, but not as much as nickel in relative terms.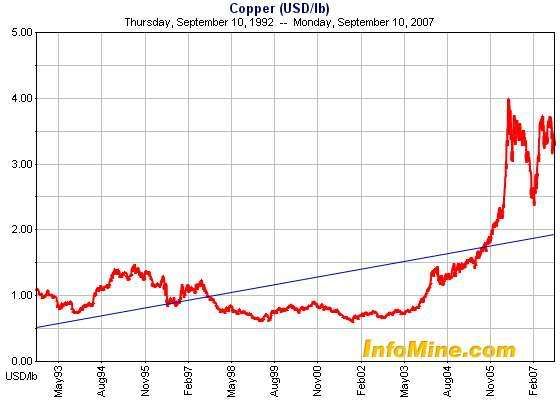
Clearly there is a price dip from 1998 to 2003. It is a time when companies were choosing to sell off valuable holding because of carrying costs and many new companies have made a fortune off what were previously cast-offs, some strictly on speculation, but quite a few by building mines. Copper price spiked to about 6x the weakest price in its history. Copper had a much stronger downward price trend that the other metals. Copper prices are strong and susceptible to downward price corrects. There are many strong “bears” about the copper market and there will be a downward price correction at some point, there always is, but the relative abundance to nickel and uranium when the size of the world market is considered makes me think that nickel and uranium are susceptible to stronger price corrections, but the uranium price corrections will lag due to the differences in building mines.
What has bigger implications for the price of copper is how many deposits like the recently discovered Noront drill results. Drill results on a press release today identify 68 meters averaging 5.9% nickel, 3.1% copper, 2.87 g/t platinum, 9.78 g/t palladium, 0.61 g/t gold and 8.5 g/t silver. In prior posts I talk about declining grade and how it is increasing costs so prices have a much higher cost support. I do not know how big this deposit will be, but if it were big, it would be profitable at very, very low copper prices. It does make me wonder if the declining grade being mined that seems apparent in report after report that I read is because mining efforts have focused on what resources that were known and real new exploration that would find high quality grades has been limited. This discovery should make investors in low quality grades very uncomfortable.
The value of gold surprised me. For something “scarce” the metal values in the ground are awfully high, $40 quadrillion dollars, or forty thousand trillions. Are there not these big market fears around the over $400 trillion in derivatives and somehow gold is supposed to prevent this by limiting the money supply? I pulled up a web page (http://www.gold.org/value/stats/statistics/gold_demand/index.html) that states that global demand for gold reached a record $14.5 billion last quarter. That’s about 1/300 millionth of the value of the metal in the ground. If 1/10th of one percent is recoverable, then that is $40 trillion available, or the supply can be expanded about 10-fold. At the current rate of mining the out of the ground gold supply is increasing by about 1.6% per year. Current the rate of mining seems small compared to the amount of gold that can potentially be mined. Infomine shows 1880 companies in their database involved with gold. I would think that strong gold prices would increase the mining and exploration activity of these companies and eventually increase output.
In order for price to go up you need to have more people/corporations wanting to hold gold as an investment. Currently more people seem to want to own the gold stocks as opposed to the bullion and the gold stock bugs seem utterly confused that the price of gold does not go up as they expect. It seems to me that until such time as there is a shift and the so called believers in gold actually own gold and/or the gold companies stop selling their gold there will be continued restraint on gold prices. Truly, the theory that banks are weak because they lack a gold standard because they’ve sold their gold equally applies to gold stocks as they sell off their hard assets for fiat currency.
Looking further, I find that at the end of 2005 there was around 155,000 tonnes of gold being stored in either jewelery or bars, or roughly $3.6 trillion dollars worth of gold, and they mining about $60 billion worth of gold each year. The value of gold per person from that 155,000 ton stockpile is about $500 and keeping prices constant, it is increasing by about $10/year per person from new mining. Certainly if people lose faith in paper money there is not a lot of already mined gold to go around, but there are many other hard assets that people can chose as investments that can also protect wealth. Gold does not appear to have the same degree of asset price inflation as other investments. Certainly if your country’s currency is declining, or at risk of declining relative to other currencies gold is probably a good currency hedge. 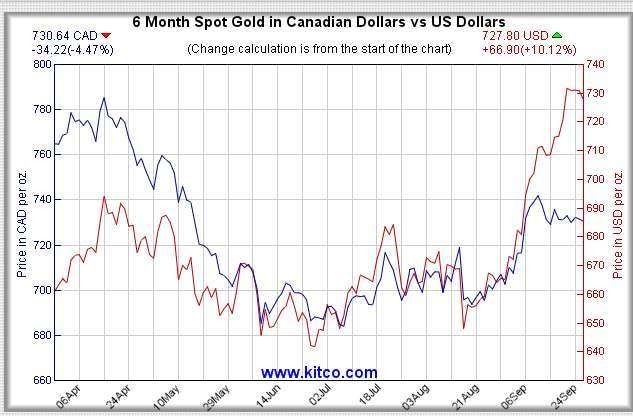
The above graph shows that if you are American and bought gold six months ago the US dollar value of your investment is up over 10%. However, if you are Canadian, the value of your investment relative to the Canadian dollar is down 4.5%.
As investors I think it is a good idea to be aware of how much actual metals exist and to use this kind of knowledge in assessing real value as opposed to apparent value in the assumption that metals in the ground today will be worth the same forever or even be stronger forever.
Looking at this makes me wonder more about iridium. It seems that the most corrosive resistant element would have market growth potential and it does not seem to have the same speculative pricing built into it.
In any event, I did quite a bit of traveling in the summer and now I am in the process of moving so I have not had the same kind of time to look at investments. So, I am still around, but not as able to be actively posting. I will probably work on shorter and less time consuming posts in the future.

3 comments :
Very original angle on metals! I wonder how academic it is however, and if there is some way to determine what percent of those metals could be mined? How deep do mines go nowadays, and what has been the accessible depth trend since the start of the industrial revolution?
Thanks Joe. I picked 1km because the Bingham Canyon mine has a hole 3/4 of a mile deep where there used to be a mountain. Bingham has mined more than 1km depth of ore/dirt.
And then, I've read news releases on drill results going much further than 1 km, for example
"Stikine Gold Corporation (SKY: TSX-V) ("Stikine" or the "Company") announces that diamond drill hole SD3 at the Sullivan Deeps project intersected a 0.4 metre interval of laminated and semi-massive sulphides, comprised primarily of uneconomic pyrrhotite, at a depth of 2,659 metres."
That one was showing they drilled to 2.7 km. At the time I was thinking of naming a post, "Stikine drilling to China..."
We don't value any non-ferrous metal derivative based on the estimated level of ore left to extract, the forward OTC and future exchange markets wouldn't function if we did
regards.
I am however interested in you calculatiosn, and how you arrived to such numeric values on any one given metal.
Post a Comment