Copper $1.50 Next Year?
Some things you read stop you mid-step and send you re-evaluating what makes sense to you. Early I posted that I believe the average price on commodities would be higher than they have been.
The evidence shows that companies were cannibalizing their assets to reduce costs when commodities reached their all time low in 2002 and set up a squeeze on supply that has caused on average about a 6-fold increase from the 2002 lows, which if the lows were reasonable, would be utterly unsustainable pricing, but the lows were as insane as some of the highs have been, like $50k/ton nickel.
Frank Veneroso has been promoting that investors are at enormous risk due to the excessively high price of commodities and he uses that benchmark low in 2002 to say copper increased to peak of 570% of its low, which is true and by using these numbers he calculates numbers and projects scenarios that would wipe out commodity investors. His report can be found on his web site, venerosoassociates.net.
Sprott Asset Management has been promoting that because of China and emerging markets commodities are in a super cycle like one that has never been seen before, and their material is worth reviewing, sprott.com/pdf/marketsataglance/04-2007.pdf.
Investors that listened to Mr Veneroso over the past couple years have missed tremendous gains in the commodity market, and certainly from my analysis I believe some of those gains are unsustainable, but an all out implosion of the sector as a whole?
Independent information, for example, DryShips, a shipping company shows historical graphs of what has been shipped to China.
This graph is for ore, but this kind of data is abundant on the Internet for shipping of commodities if you look at shipping companies. Indeed, shipping companies have done very well because of this utterly enormous increase in imports from China. By all accounts, China has been a sinkhole for commodities.
If I hand pick the low, as Mr Veneroso has, and contrast it to the high in terms of shipping, 7.4 m tons from December 02 to 29.5 m tons in Feb 06 is a 4-fold increase in ore imports, but that is over stating the growth of imports as is Mr Veneroso’s claim of 570% for copper. Overall, China’s demand for commodities has grown and the growth or ore is about 2.5 times what it was about 5 years ago.
Steven Saville maintains that the global boom in commodity prices is driven by inflation, not real growth, and his post, stockhouse.com/shfn/editorial.asp?edtID=19969, is worth reading. What particularly got my attention was the graph of SS CPI Adjusted Copper Price.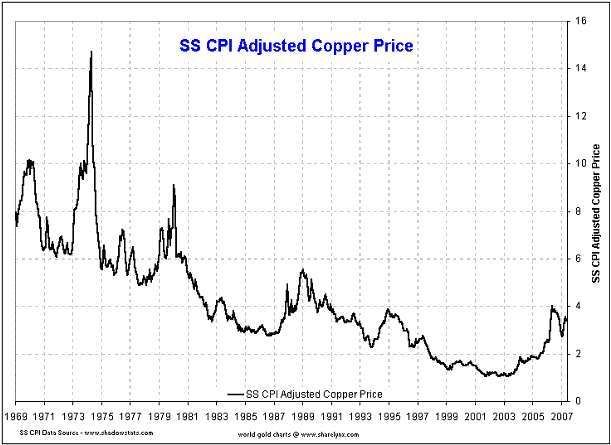
A strong criticism of the Veneroso report is that he uses government inflation data, data that if anyone compares to their true costs knows is a blatant lie. I have calculated that the inflation that I have experienced in my non-discretionary costs is more like 5-6% over my adult life, and something I recently read pointed out that US government data specifically excludes housing, food and energy. Veneroso’s report would be more useful in assessing where commodities actually stand if it took into consideration realistic inflation rates because there are some truths to some of the things he says.
If anything, Saville’s graph shows a downward price trend with high levels of volatility and possibly the beginning of an upward trend.
So, what is the “truth”?
Investors need to come with their own "truth" that makes sense to them based on the evidence presented to them. What seems plausible to me may not seem plausible to others. Only time will tell which “truth” was correct.
For me to come up with what seems plausible I look at a bigger picture, and I go back a hundred years and try to relate what I am seeing to what I believe to be true.
So, a hundred years ago the concept of open pit mines was utterly new and a grade of 2% copper, stellar by today’s standards, was considered low grade. Mining was predominately underground and equipment obviously antiquated. Adjusting for inflation the price of copper was actually around today’s price, and if you further adjusted it for the manipulation to understate inflation, the price of copper was actually grossly higher than today. The graph above does show that copper had been declining in price and I would suggest that to go back further you would find a much longer term decline in the price of copper.
So, technology improved and the leverage of work output improvements to each worker declined as machines continued to get bigger and better. It is analogous to computer technology. In the 90s each computer upgrade was 100s and perhaps 1000s of times better, but lately upgrades are well under 100% better.
For mining, it would not surprise me if the efficiency of workers has improved because of these bigger machines so that one person in the actual mine does in the range of 100 times the productivity of 100 years ago. A lesson from my schooling is that real wealth is created by this kind of efficiency of leveraging worker output and it enabled wages to increase, prices to decline and I suspect, at least for copper, that it hid an overall declining grade of copper being mined over the last 100 years.
The Bingham Canyon mine started mining a 2% grade and the grade they now mine is less than 1/3rd of that. Some minerals are far more abundant, like aluminium, so over all grade declines would not be as significant, and for me, that is the most plausible reason aluminium has not seen the same degree of ramp up on price. It is my guess based on what I know about the world.
Today’s machines have reached limits of technology. You can’t build a 30-story wood frame building because the tensile strength of the wood will not allow it, as are the limits of today’s machines. There may yet be technological improvements, but they will be much slower coming and they will never give the kind of leveraged improvements of the past.
Living in BC, my truth points to a very strong other source of leverage of earnings for mining companies as the gains in technology declined – the export of jobs to countries employing slave labour wages. In BC in the 80s mines closed and were no longer economically sustainable. The move of the mining industry to countries with lower wages allowed the continued overall decline in commodity prices. Mines with good grades in North America were sustainable, but this trend wiped out lower grade mines.
The move of highly leverage productivity jobs to other countries empowered workers and workers have demanded and gone on strike for better wages and working conditions in these other countries, so the wage gap has declined and the options to export jobs to lower paying countries has dried up.
So, basically not a single economy of scale to reduce prices exists anymore, not increased leverage of output due to technology, not export of jobs to cheaper countries and to top it off, declining grade of mined ores can not longer hide behind these effects. I believe many analysts are missing the decline of grade in their analysis when they come up with something like $1- to $1.50 copper as a long-term price.
And then there is yet another point to take note of, the over burdening level of US debt and spending that is killing the US currency. Commodity prices are quoted in US dollars and there has been an enormous decline in the US dollar with respect to other countries, for example, Canada, Australia, Russia, Chile, and China.
Canada vs US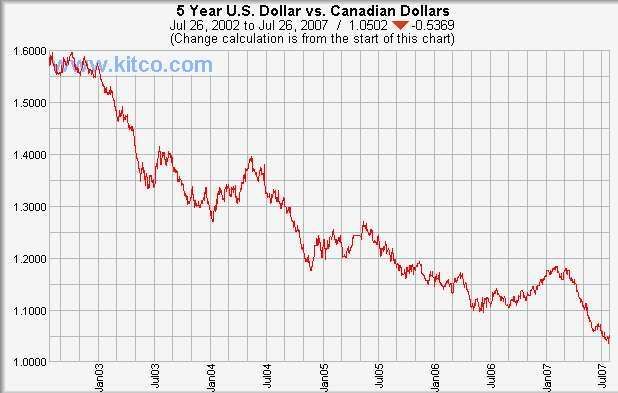
Australia vs US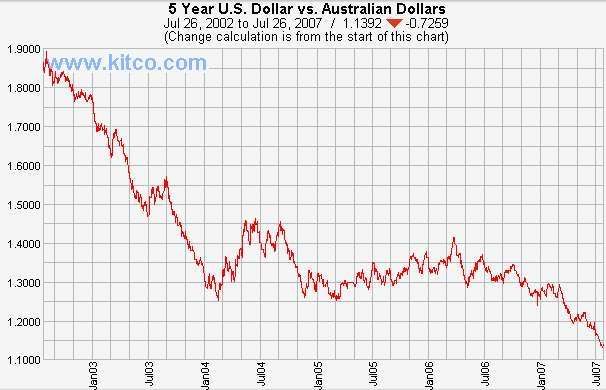
Russia vs US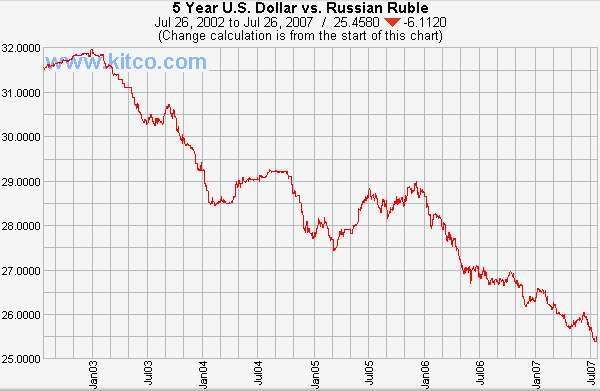
Chili vs US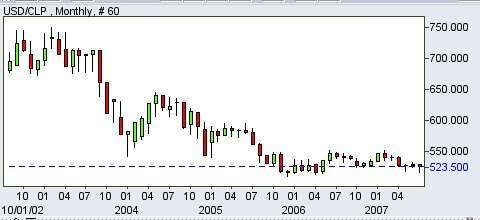
China vs US (2 yr)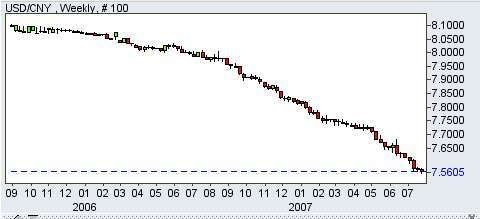
The US dollar has not declined with respect to all countries, but in terms of the world market, the US commodity price quote has not increased to the same degree if the prices were quoted in other currencies.
So as I see it, there are four driving forces for increased commodity prices:
- Inflation
- Wage demands in excess of inflation
- Declining grade which leads to increased costs
- A declining US currency
Considering these factors, I simply cannot see a long-term copper price being less than about $2, and costs for producing commodities will exceed the rate of inflation overall. Indeed, a real risk to investors is declining margins due to increasing costs.
However, an estimate of a long-term price isn’t a statement of belief that prices will never go below the price. Clearly, in 2002 prices were below a long-term sustainable price, as they are currently most likely above a long-term sustainable price.
Read More......
![[Most Recent Quotes from www.kitco.com]](http://www.kitconet.com/charts/metals/base/spot-lead-5y-Large.gif)
